Market Recap for Thursday, August 17, 2017
For now it's just a short-term issue, but money is rotating to defensive areas and fear is rising. The Volatility Index ($VIX) jumped over 32% yesterday to close at its 5th highest level of 2017. The highest close of 16.04 is just 3% away so clearly nervousness is becoming an issue and is driving these much larger daily selloffs. The NASDAQ 100 lost more than 100 points on Thursday, its sixth such decline in the past three months. Prior to May, the last time the NASDAQ 100 lost 100 points was on September 9th, 2016. This volatility is definitely becoming unnerving. But worse yet, traders are growing accustomed to it as we see rallies follow. This is setting up market participants for a much larger drop and a VIX move above 20 in my opinion. That wouldn't necessarily be a bad thing as it would help to alleviate the weekly negative divergences that have signaled slowing price momentum since earlier this summer.
Gold ($GOLD) rose 0.74% to 1292 on Thursday, touching a recent price resistance zone:
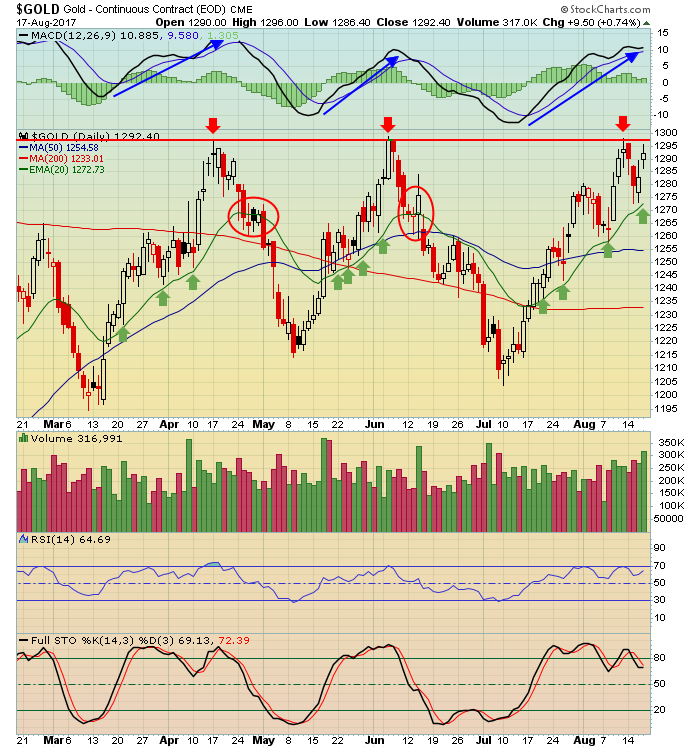 As famous baseball great Yogi Berra would say, "it's deja vu all over again!" GOLD has touched price resistance near 1300 for the third time in the past four months. Each of the previous two rallies have failed and the key has been the failure of the rising 20 day EMA (red circles) to hold as support. Currently, the rising 20 day EMA is providing solid support (green arrows) - just as it did during the previous rallies. Therefore, keep an eye on this critical short-term support as a clue as to future direction here. But the above chart is just the start of the conversation on GOLD. Check out the long-term trendline resistance also being tested:
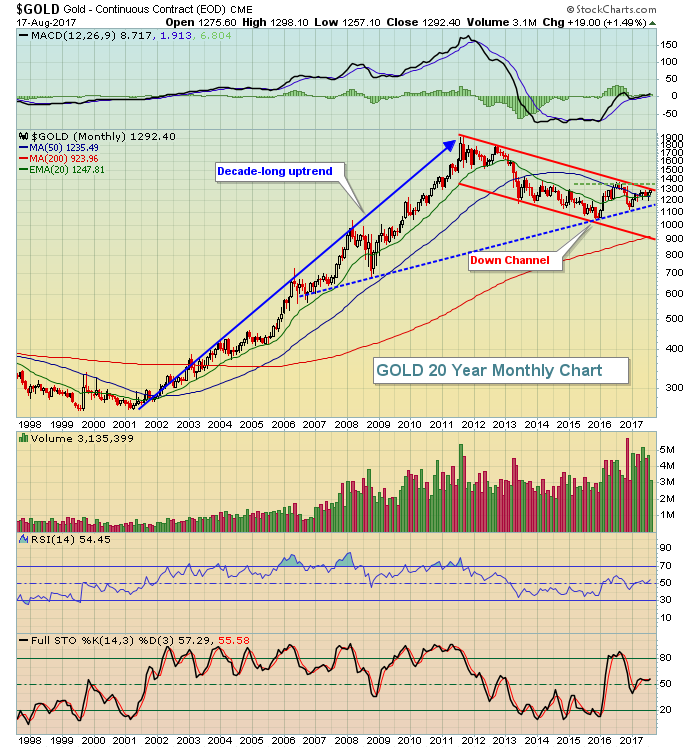 From the above, you can see that this upcoming test of 1300 resistance is no ordinary test. It's big. Short-term resistance is obviously at 1300 as we've seen multiple failures at that level in 2017. And while trendlines can be very subjective depending on how you draw the line, it's fairly obvious to me that this 1300 area is big in the longer-term picture as well. Whether this breakout occurs likely will be determined by how the U.S. Dollar Index ($USD) performs from here. The USD closed on Thursday at 93.53 and has major long-term support in the 92-93 range. If the dollar fails to hold support there, that would provide even more ammunition for GOLD to begin a major run higher.
Pre-Market Action
Applied Materials (AMAT) provided solid quarterly results after the bell on Thursday and this morning we've seen a solid reaction to Estee Lauder's (EL) quarterly results. Deere & Co. (DE), on the other hand, is getting crushed.
Dow Jones futures are up by 4 points with 30 minutes left to the opening bell.
Current Outlook
Volatility is picking up in a trading range for now on the NASDAQ 100, but loss of 5788 price support would likely trigger another violent selloff. Here's the chart and key levels to watch:
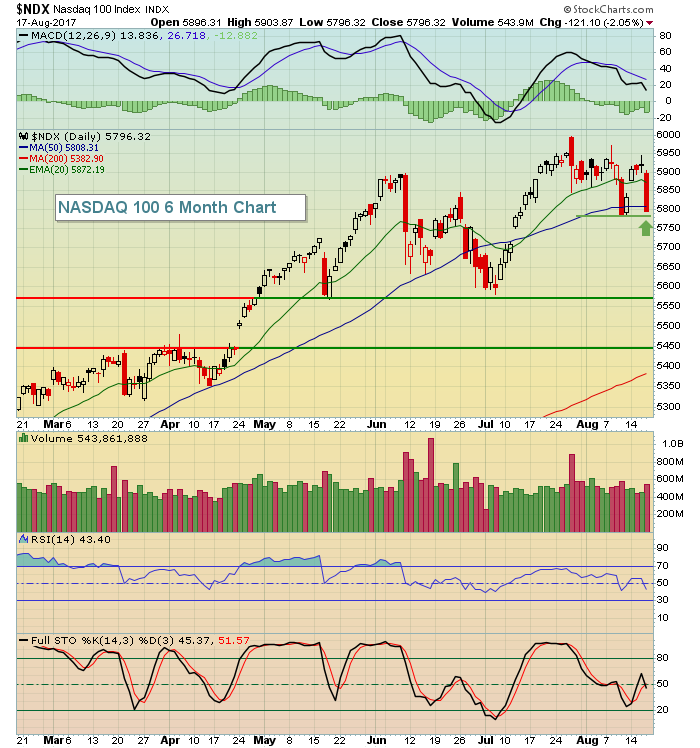 If the lows from last week don't hold, I see little price support until we hit the 5575-5600 area. The weekly RSI is now down to 43 and we're nearing short-term support so perhaps we'll see a quick bounce. If 5788 support is lost, however, all bets are off.
Sector/Industry Watch
Over the past three months, the Dow Jones U.S. Industrial Suppliers Index ($DJUSDS) has been the worst performing industry group within industrials and one of the worst overall. There is a silver lining, though, as the DJUSDS is now approaching a very critical price support level as you can see below:
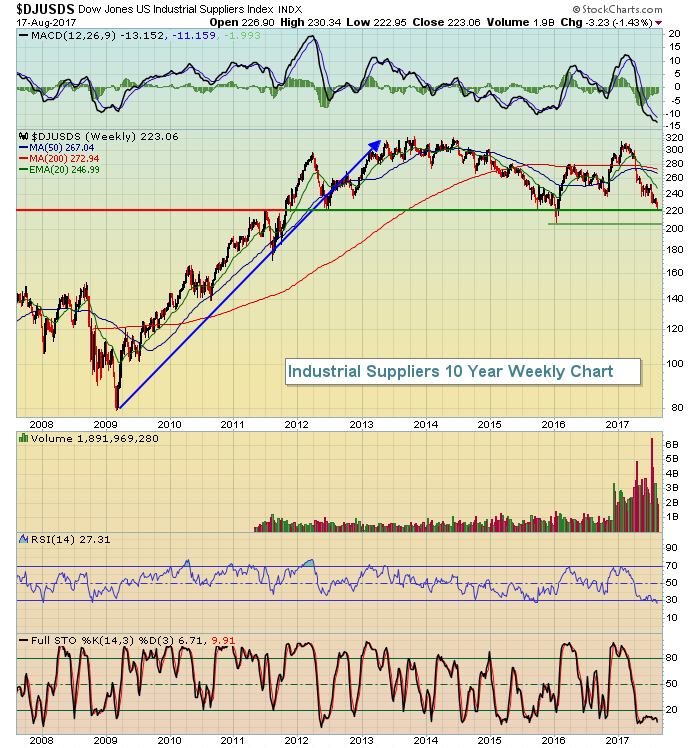 Over the past several years, the 320 level has proven to be very difficult resistance, while 210-220 has been excellent support. Given Thursday's close of 223, the reward to risk for this group has turned decidedly bullish, even if its chart hasn't. Since the January high, the DJUSDS has fallen more than 25% to easily rank as one of the worst areas of the market to have invested in 2017. That could soon change, however, so identifying solid companies within this space might not be a bad idea should we begin to see money rotate for a technical bounce into year end.
Historical Tendencies
The Russell 2000 is mildly bearish from a historical perspective over the next week - through the 25th. The RUT's annualized return for this period since 1987 is -18.80%.
Key Earnings Reports
(actual vs. estimate):
DE: 1.97 vs 1.93
EL: .51 vs .43
FL: .62 vs .90
Key Economic Reports
August consumer sentiment to be released at 10:00am EST: 94.0 (estimate)
Happy trading!
Tom
