Market Recap for Friday, August 21, 2017
Late day selling killed the market's earlier attempt to rebound from Thursday's heavy losses. A market that finishes multiple days in a row weak is a market that requires a renewed buying effort. While we could see that at any time, let's keep in mind that it's the 21st day of August and this is the time of all calendar months that we need to be careful.
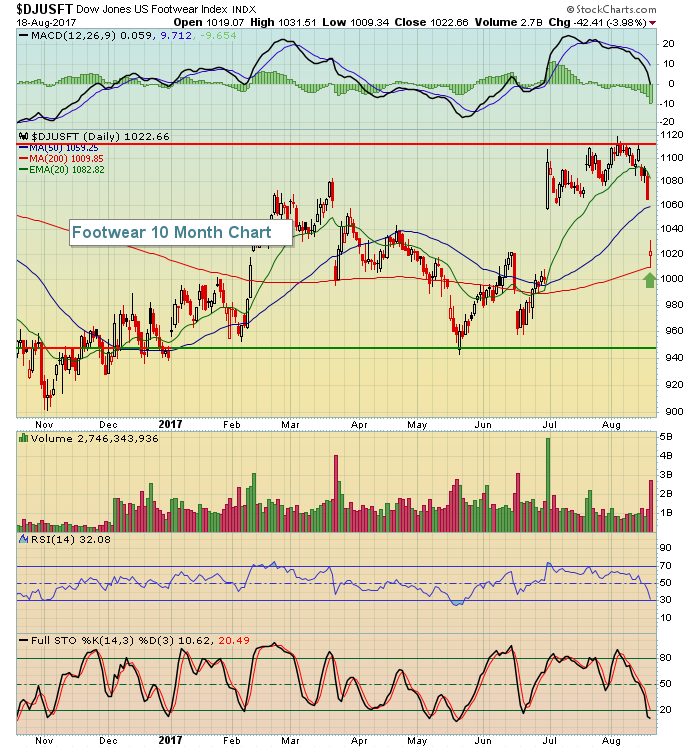
Despite the selling, we did manage to see four sectors finish in the green on Friday, including utilities (XLU, +0.59%) and energy (XLE, +0.50%). On the other end of the spectrum was consumer discretionary (XLY, -0.50%), healthcare (XLV, -0.46%) and industrials (XLI, -0.40%). Among cyclicals, footwear ($DJUSFT) was the hardest hit, falling nearly 4% on the session with leader Nike (NKE) taking a big hit. Here's the latest chart:
 While the 200 day SMA did manage to hold as support, the bigger picture shows a very wide trading range for the DJUSFT. Support resides near 950 while the clear resistance level is just above 1110.
Pre-Market Action
Futures are slightly lower this morning as the market will deal with a total solar eclipse and very little fundamental news. The earnings slate is relatively light and there are no significant economic reports due out. Short-term technical indicators will take over and most of them turned bearish last week.
Dow Jones futures are down 16 points as we prepare to kick off another trading week in 30 minutes.
Current Outlook
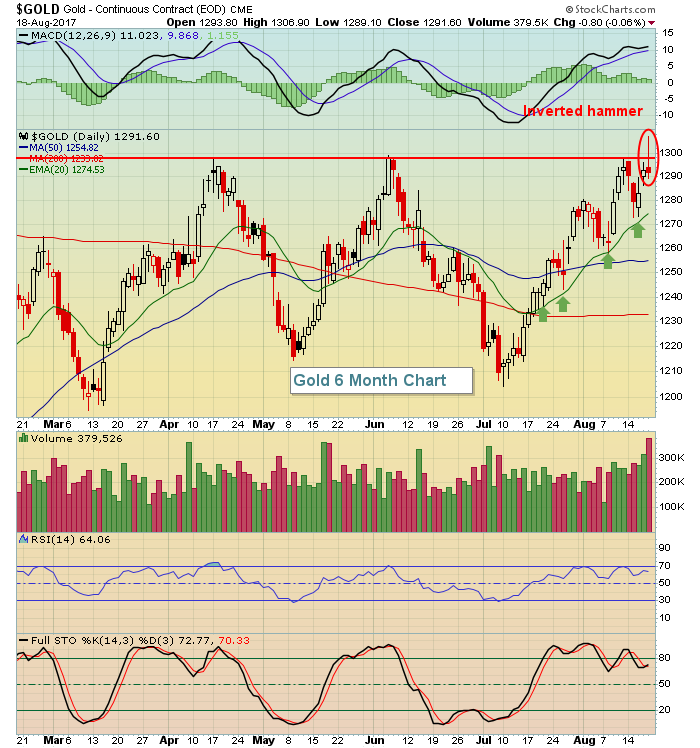
Gold ($GOLD) set the stage on Friday for a major breakout at it topped $1300 for the first time since early November. This isn't just a price resistance issue, however. There's a long-term downtrend line that began in 2011 and it intersects very close to that $1300 level as well. Trend lines are quite subjective, though, and while I believe the six year downtrend line hasn't been cleared yet, others might disagree. Furthermore, I don't like that reversal on Friday on the daily chart. Check it out:
 That is one ominous candlestick. The fact that it's occurring at a major resistance level on the daily chart is significant, but also remember it's occurring a major long-term downtrend line as well. If I were long GOLD (or the GLD), I'd take profits here and see if GOLD can make the breakout this week. You can always jump back in slightly higher if resistance is cleared. If the long-term downtrend kicks in from this level, it might be a long time before GOLD sees $1300 again.
Sector/Industry Watch
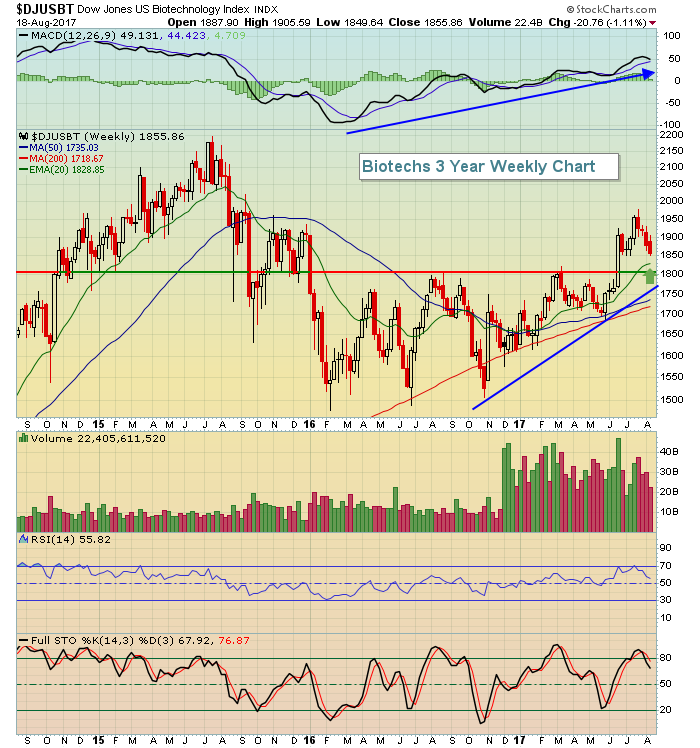
Biotechs ($DJUSBT) were among the big losers last week as the group fell more than 1%. However, they finished well above price support at 1800 and their rising 20 week EMA, currently at 1828.85. After breaking above 1800 in June, I believed it was the start of a significant trend higher that would test the 2015 high near 2200. I still believe that's the case. The combination of price support and rising 20 week EMA support, though, is critical. So if the overall equity market struggles throughout the balance of August and into September, I'll be watching these two levels very closely. Here's the current chart:
 While we've seen selling in this group for the past four weeks, as we have the overall market, the volume on the selling has been declining. When the market rebounds, I'm looking for leadership among the biotech names.
Monday Setups
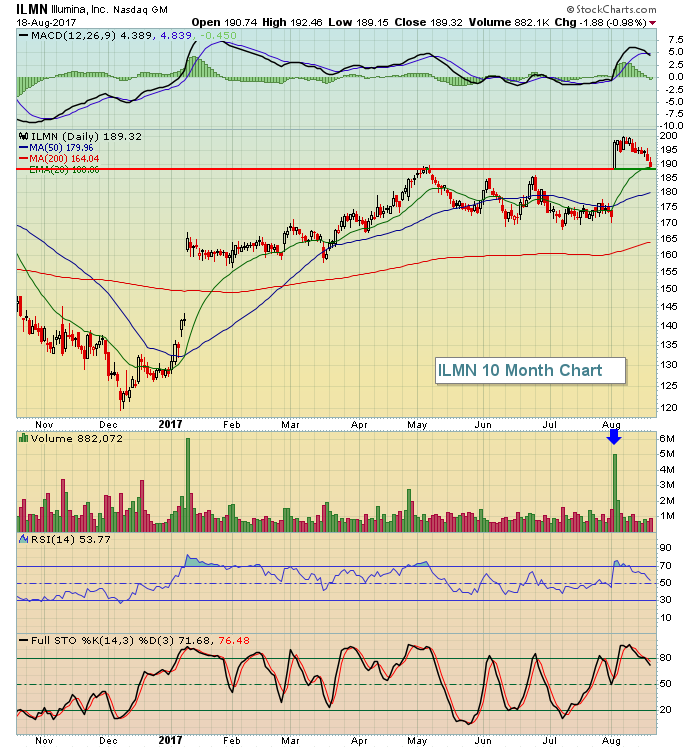
I'm still very much a fan of the biotechs ($DJUSBT) so I like Illumina, Inc. (ILMN) with the selling last week. It's returned to its rising 20 day EMA and also is very close to testing key gap support at 188.00. Here's the chart:
 Should the biotechs remain weak, the next two key levels of support on ILMN would be 185 price support and the rising 50 day SMA, currently near 180.
Historical Tendencies
The last total eclipse was on July 11, 1991. On that day, the S&P 500 gained 1.23 points to close at 376.97. Apple (AAPL) closed at 1.43 that day. Apparently, buying AAPL on total solar eclipse days results in retirement 26 years later. :-)
Key Earnings Reports
None
Key Economic Reports
None
Happy trading!
Tom


