Market Recap for Tuesday, September 26, 2017
Late day selling created a bifurcated U.S. market on Tuesday as small caps performed quite well ($RUT, +0.34%), while the Dow Jones finished slightly in negative territory. Technology (XLK, +0.36%) rebounded after Monday's selling to lead most of our indices higher. Consumer stocks also performed well with consumer staples (XLP, +0.24%) posting a decent gain. Consumer discretionary (XLY, +0.01%) was mostly flat, but outperformed the other six sectors. Materials (XLB, -0.44%) was the weak link, but after very solid gains this month, it was entitled to a little profit taking. Here's the current chart for the XLB:
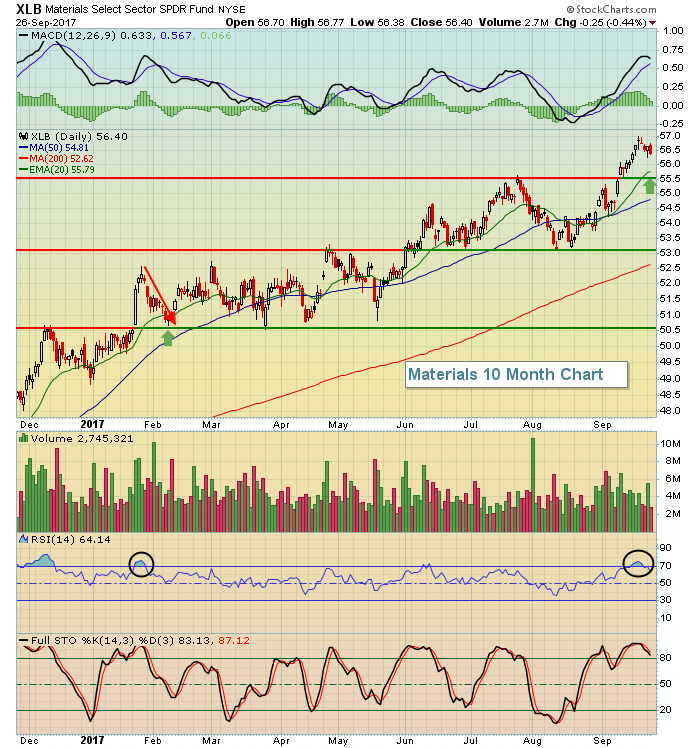 The black circles on the RSI show that January was the last time that the XLB was as overbought as it was to end last week. Back in January, we saw the XLB pull back in the very short-term to relieve its overbought conditions and test key price support just beneath the 20 day EMA. The green arrows mark that support level, along with a potential upcoming test of price support near 55.50 if we see rotation take a bigger chunk out of materials stocks. The XLB remains technically sound, just overbought.
Pre-Market Action
Dow Jones futures (+27 points) are poised to rise as we work our way toward the end of September. One big development this morning is the surge in the 10 year treasury yield ($TNX), now up nearly 8 basis points to 2.31%, the highest level for the TNX in nearly two months. A big spike in the TNX indicates heavy selling pressure in treasuries....and that tends to lead to big gains in equity prices as the treasury proceeds roll over into equities. We'll see if that pattern develops later today with equities.
Current Outlook
Bull markets love rotation. Throughout 2017, the bull market has continued despite weakness in key areas like energy and transportation. But now we're beginning to see both areas pick up steam to help offset weakness in other areas like technology. That's exactly what we want to see - when one leader falters, another group steps up. Energy (XLE) has been on fire and it seems that transports are on the verge of following suit. Railroads ($DJUSRR) and truckers ($DJUSTK) have already been on a roll and now we're awaiting airlines ($DJUSAR) to join the party. October is seasonally kind to airlines, by the way.
Typically, when we see transports ($TRAN) outperform utilities ($UTIL) - especially breaking relative downtrends - it results in strength in the S&P 500. Check out this chart:
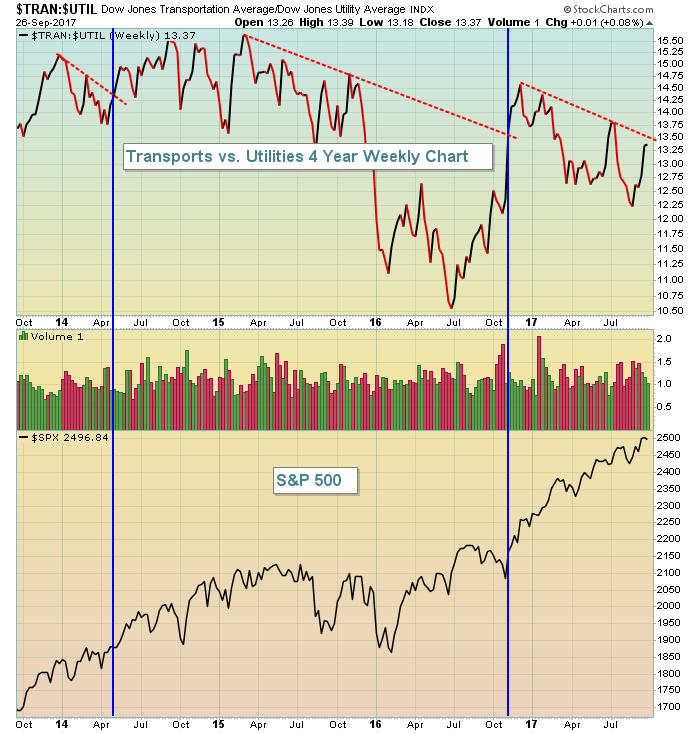 You can see from the above that the 2017 bull market has continued despite relative weakness in transports (vs. utilities). A breakout of the 2017 relative downtrend line, however, would be a very good sign for U.S. equities in general as a rising TRAN:UTIL suggests economic growth ahead and a "risk on" mentality among traders.
Sector/Industry Watch
Over the past month, utilities (XLU) is the only sector that's moved lower and it's down by roughly 2%. Rising treasury yields are a definite head wind for utilities and that's been the case in September. While all the other sectors boast one month gains and many industry groups within those sectors have soared, there have been a few exceptions and one of those exceptions has been the Dow Jones U.S. Broadcasting & Entertainment Index ($DJUSBC). The DJUSBC is now trading in a very narrow range where we're soon going to find out whether the longer-term uptrend continues or whether the September weakness is more likely to extend into the fourth quarter. From a seasonal perspective, the fourth quarter is the group's strongest quarter by far.
Now let's turn our attention to the recent technical developments - first on a longer-term weekly basis:
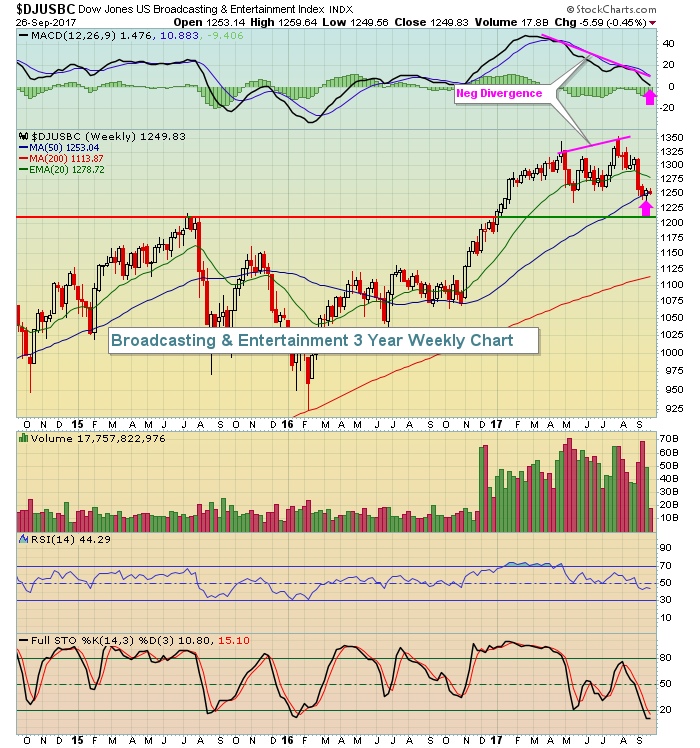 There were serious momentum issues that led to the recent underperformance in the DJUSBC. We've now seen a 50 week SMA test and a MACD centerline "reset", so this group could be poised for a significant rally. However, if shorter-term support is lost, then look for a possible test of price support near 1210.
So where's the short-term support and resistance?
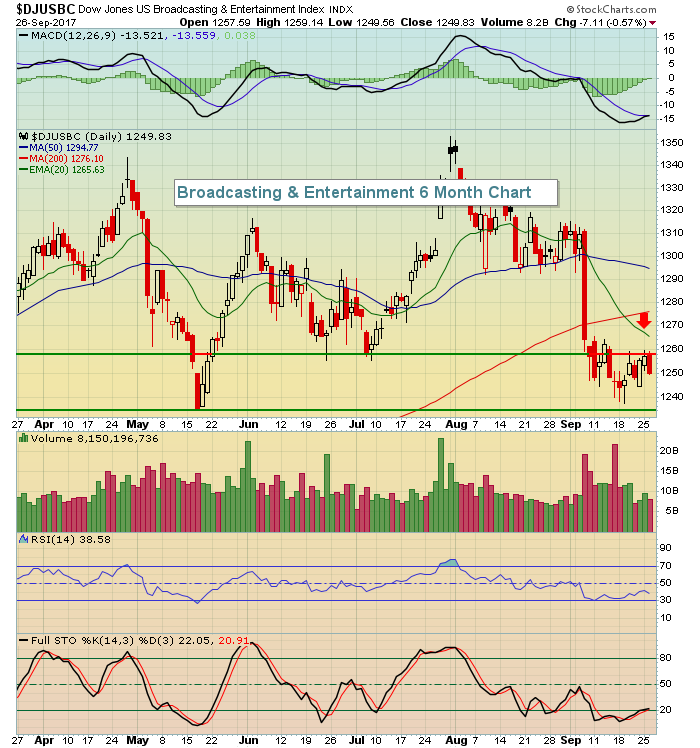
Short-term resistance is from 1260 (recent price resistance) to the declining 20 day EMA, currently at 1265. To the downside, the May low just above 1230 is very significant price support. Therefore, I'd look for a short-term trading range between 1235-1265. A break below would likely lead to the price support level on the weekly chart, while a breakout above 1265 would likely be a signal that the longer-term uptrend has resumed.
If you look at the daily MACD above, you'll note it's beginning to rise. That suggests the DJUSBC would be very likely to print a positive divergence at the same time it tests the May low - should the recent selling continue for the next several days.
Walt Disney (DIS) and Time Warner (TWX) are a couple of the big names in this index. The latter has just completed a very bullish cup. A pullback to test the rising 20 day EMA would be bullish, as would be an outright breakout.
Historical Tendencies
Everyone always hears the "Go Away in May" mantra each spring season, but I stand by history which emphatically states that the May through mid-July period is not bad historically for U.S. equities, especially small cap stocks. The true "go away" period begins at the close on July 17th and ends at the close on September 27th. Today is September 27th.
Over the past two decades, October and March have been the best individual months in terms of S&P 500 performance. In my view, October is much more powerful, however, as it's followed by two very bullish months - November and December. Here's the seasonal chart:
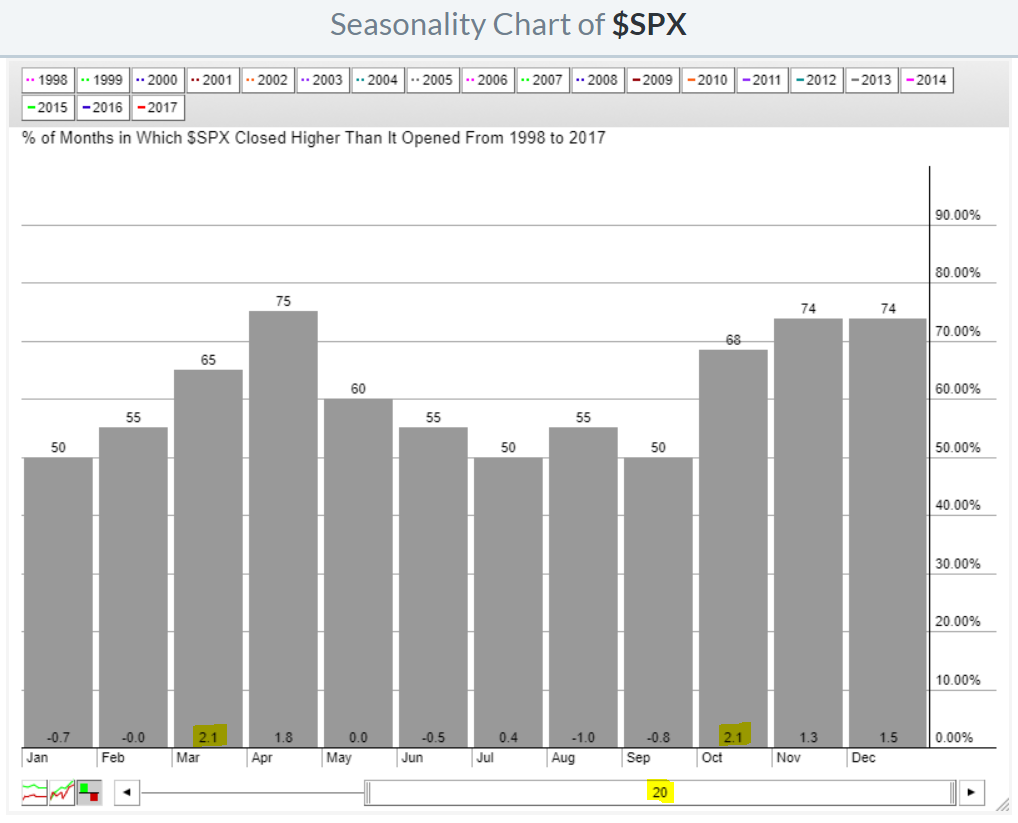 At first glance, that May through July performance might support the Go Away in May theory, but just keep in mind that there are periods within those calendar months that are very bullish, namely May 25th to June 5th and June 26th to July 17th.
Key Earnings Reports
(reports after close, estimate provided):
PAYX: .60
Key Economic Reports
August durable goods released at 8:30am EST: +1.7% (actual) vs. +1.5% (estimate)
August durable goods ex-transports released at 8:30am EST: +0.2% (actual) vs. +0.4% (estimate)
August pending home sales to be released at 10:00am EST: -0.2% (estimate)
Happy trading!
Tom


