Reminder
Be sure to scroll down to the bottom of my article and click the "Notify Me" button if you'd like to receive my article each morning before the stock market opens. The subscription is FREE and my article is a great way to start your trading day! Thanks!
Market Recap for Tuesday, September 19, 2017
Outside of a fractional loss on the Russell 2000 ($RUT), U.S. equities once again rallied as our major indices continue to set all-time closing highs each day. Yesterday marked the eighth consecutive day of gains on the Dow Jones, with the last five setting all-time high closes.
There was bifurcated action at the sector level with strength in five sectors, including financials (XLF, +0.76%), materials (XLB, +0.51%) and technology (XLK, +0.44%). The latter broke out to a fresh high on Tuesday as you can see below:
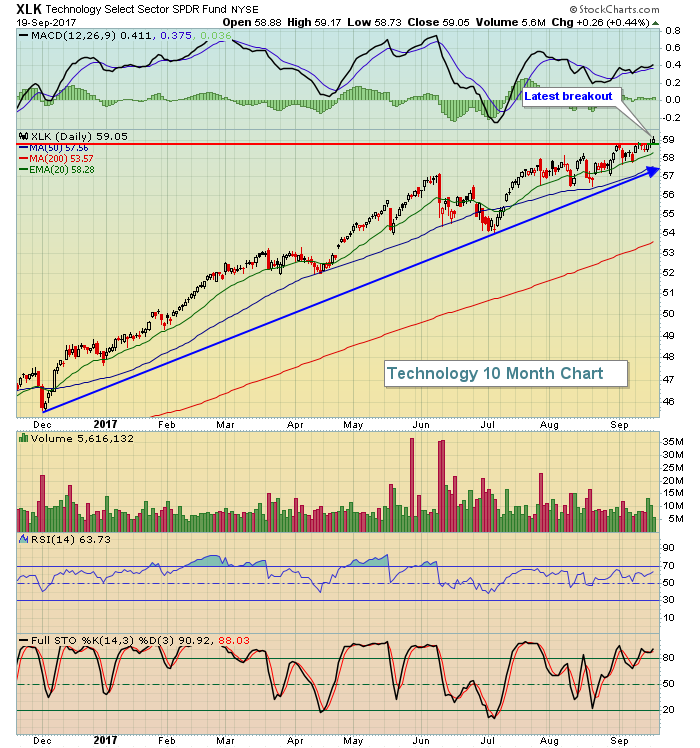
We want to see the aggressive areas of the market lead and participate as our major indices set all-time highs, so the breakout yesterday in technology shares is significant technically. Materials broke out a few sessions ago and financials are ready to make that breakout as well, though such breakout could depend largely on reaction to today's FOMC announcement at 2pm EST.
Healthcare (XLV, -0.79%) showed relative weakness on Tuesday, but remains healthy on its daily and weekly charts.
Pre-Market Action
All is quiet on Fed day. Dow Jones futures are down 6 points as we head towards the opening bell.
Bonds are flat, gold is up slightly and crude oil continues to hover around $50 per barrel. We saw slight gains in Asia overnight and we're seeing mostly tiny losses in Europe this morning. Today is all about the Fed. Let's see what Fed Chair Yellen has to say at 2pm and go from there.
Current Outlook
The 10 year treasury yield ($TNX) has been on a tear higher over the past couple weeks, but this has only continued a disturbing 2017 trend - short spurts higher, followed by lengthy declines. While it might make common sense for us to want lower interest rates to help spur economic growth, the fact remains that interest rates are already low! Seriously, the TNX closed yesterday at 2.24%. Here's a chart of the TNX over the past 50 years:
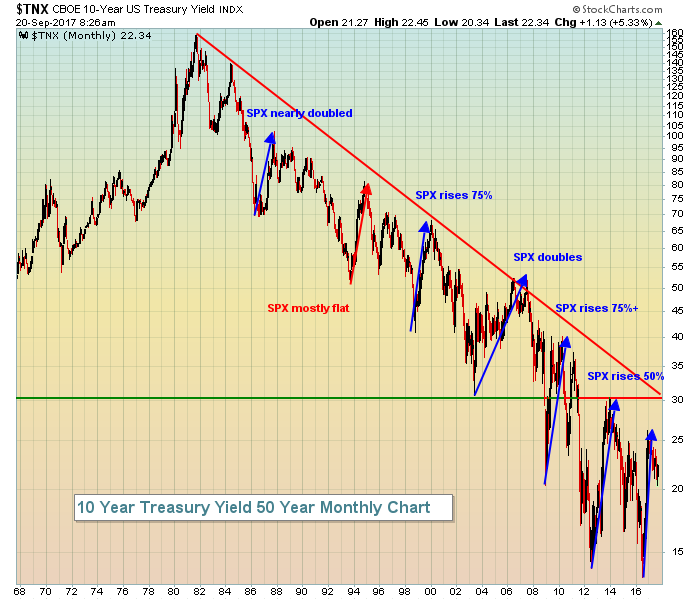 Spikes in treasury yields during an overall longer-term downtrend in interest rates is exactly what the stock market needs. The blue directional lines above mark shorter-term periods of time where we've seen treasury yields spike. And in just about every case, the S&P 500 soars. Why? Well, treasury prices tend to drop when traders believe our economy is strengthening or is about to strengthen. That strengthening helps Corporate America's bottom line, which in turn drives S&P 500 prices higher. It's also simply a case of money rotating. As traders sell treasuries (sending corresponding yields higher), where does that money go? The stock market.
So while you might think that lower interest rates would work out better for you, that thought process depends on whether your personal balance sheet is heavier on the investment side or debt side (debts with variable interest rates like credit cards, etc.). If you have a lot of your net worth in equities, you actually want to see interest rates on the rise.
Sector/Industry Watch
The Dow Jones U.S. Waste & Disposal Services Index ($DJUSPC) recently broke out of an ascending triangle and its momentum (daily MACD) is very strong. Check out this industry breakout to help support the recent rise in the S&P 500:
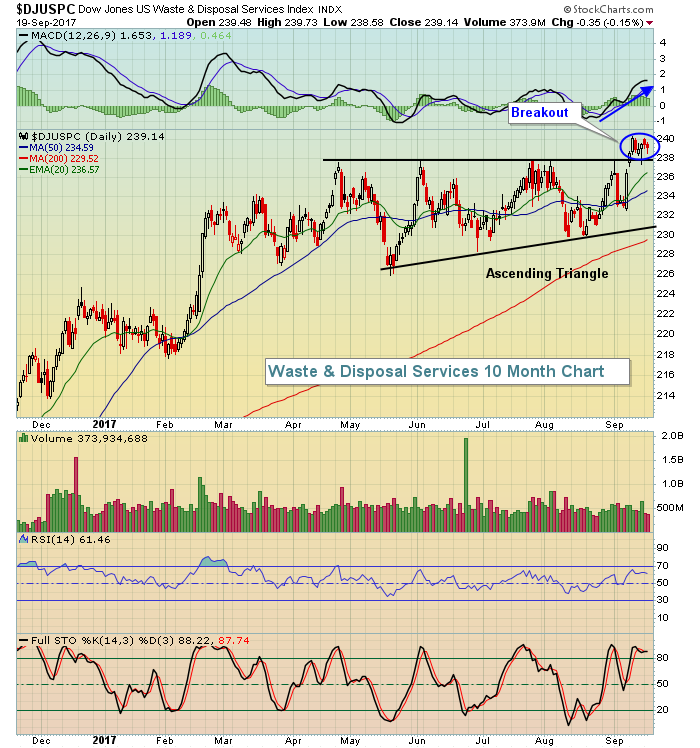 Price support and rising 20 day EMA support are the two key support levels and they're at 238 and 236, respectively. Given the strength of the MACD, any pullback to those two levels would suggest entry into the space. I would look to individual stocks within the index as potential trading candidates on any short-term selling in the group.
Historical Tendencies
The end of calendar years tends to be very strong for U.S. equities. But there are two stocks in the NASDAQ 100 that average negative returns from September through December. One is JD.com (JD), but I'll excuse this end of year lackluster performance because the stock has only been public for a little more than three years so there's really not a large, representative sample size from which to draw reasonable conclusions. But priceline.com (PCLN) is a very different story. Check this out:
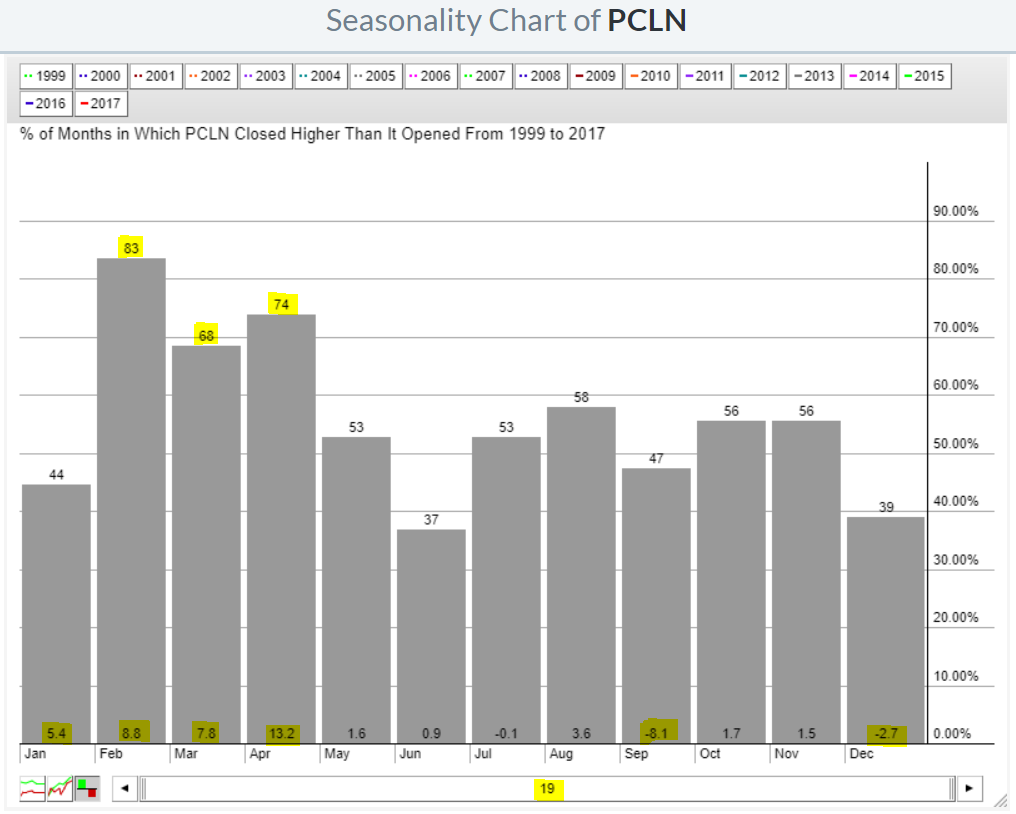 PCLN is a stock - at least seasonally - that you want to own during the first four months of the year, not the last four. True to form, PCLN recently gapped lower in August and has struggled thus far in September to show signs of strengthening technical conditions.
Key Earnings Reports
(actual vs. estimate):
GIS: .71 vs .77
(reports after close, estimate provided):
RHT: .47
Key Economic Reports
August existing home sales to be released at 10:00am EST: 5,480,000 (estimate)
FOMC meeting ends and policy decision released at 2:00pm EST
Happy trading!
Tom
