Market Recap for Wednesday, September 20, 2017
It was another stellar day for industrials (XLI, +0.73%) as this sector led the Dow Jones to a 6th consecutive record closing high. The gains have been fairly slow and methodical, but that's how bull market advances work. They tend to occur very slowly in boring fashion as volatility ($VIX) drops day after day. After the VIX closed at 12.23 on September 5th, it's dropped nearly every day and closed yesterday at 9.78. It's rare to see the VIX below 10 historically so take note of this lack of expected volatility ahead. It's flashing a very bullish signal.
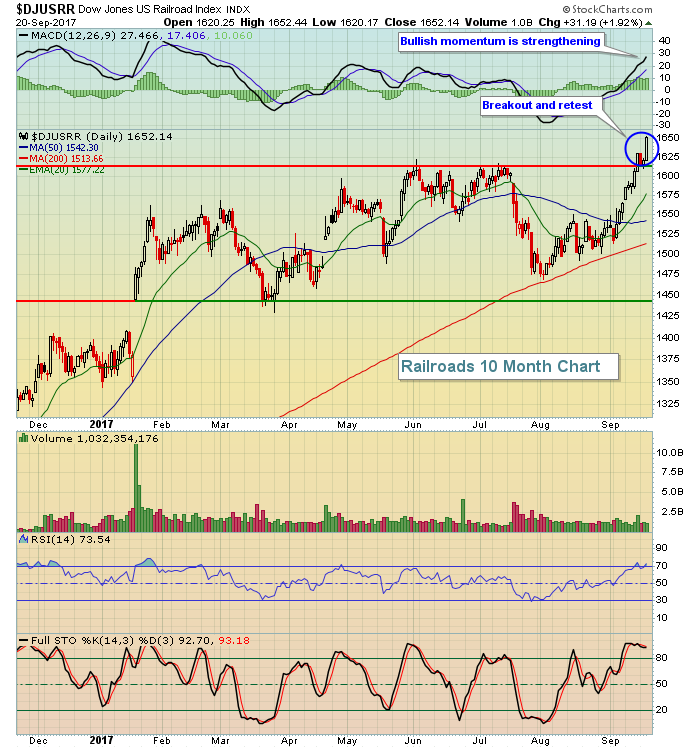
Railroads ($DJUSRR) led the industrials barrage. After a breakout above the double top from June and July, the DJUSRR briefly tested that breakout level, then soared yesterday. Here's the chart:
 The strength in railroads helped the Dow Jones Transportation Average ($TRAN) to a 1.55% gain and this index now stands just 1% below the high reached in July. A breakout in the TRAN to accompany a breakout in the Dow Jones Industrial Average ($DJI) is very bullish according to the Dow Theory. Based on the technical strength in railroads and truckers ($DJUSTK) and the upcoming bullish seasonal period for airlines ($DJUSAR), it looks to me like it's only a matter of time before the TRAN confirms the latest DJI breakout.
Most sectors advanced on Wednesday, although Apple's (AAPL) dip beneath 155 price support spooked many of the large cap technology (XLK, -0.41%) names. Nonetheless, it was the defensive utilities (XLU, -0.74%) and consumer staples (XLP, -0.96%) sectors that performed the worst on Fed announcement day. After the announcement, the 10 year treasury yield ($TNX) resumed its uptrend and that sparked further selling in defensive issues. Brewers ($DJUSDB) were particularly weak within the consumer staples space as they broke to 2017 lows after failing to hold the double bottom support from June/July near 910.
Pre-Market Action
We saw a couple of solid economic reports this morning with both initial jobless claims and the Philadelphia Fed Survey easily beating Wall Street consensus estimates. The 10 year treasury yield ($TNX), however, has responded initially with a slight drop to 2.26%. The TNX moved considerably higher at 2pm EST yesterday after the Fed announcement.
Current Outlook
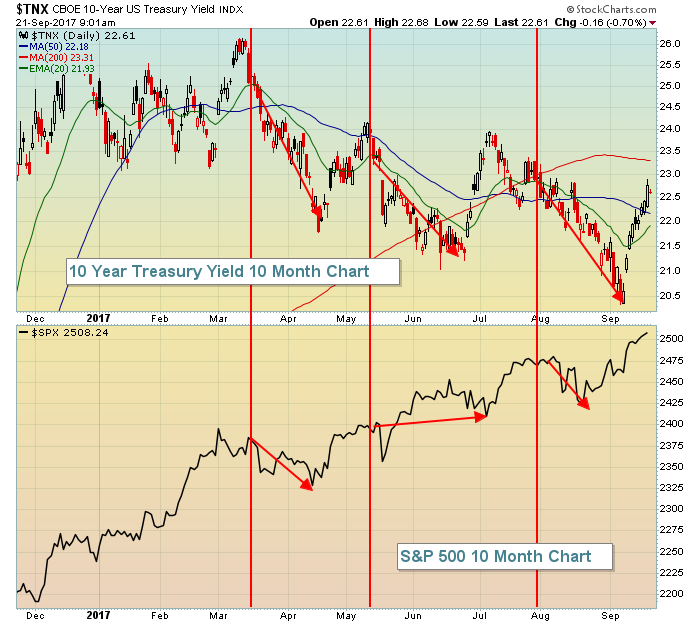
Now that the Fed announcement is behind us, all eyes will likely veer away from treasury yields. I think that's a mistake. As I posted yesterday, short-term spikes in treasury yields positively correlate to very strong moves higher in the benchmark S&P 500. So losing focus on interest rates right now is not suggested. When the TNX lost its rising 20 day EMA support during yield rallies in March, May and July, that quietly interrupted nice advances in the S&P 500. Therefore, I'd keep a very close eye on any TNX pullbacks. Loss of 20 day EMA support could spell trouble for equities - at least temporarily. Here's a quick look:
 Falling yields mean that treasuries are being bought and that can lead to a declining equity market to fuel the treasury price rise. For a longer-term correlation between the TNX and the direction of the S&P 500, check out the Current Outlook section in yesterday's Trading Places blog article.
Sector/Industry Watch
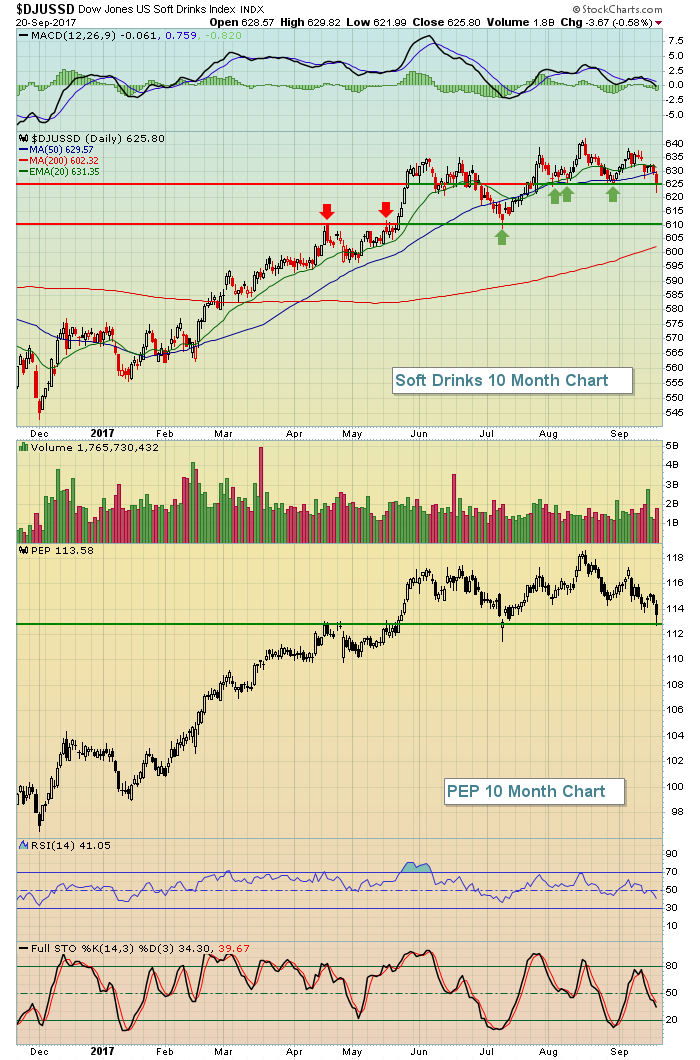
The Dow Jones U.S. Soft Drinks Index ($DJUSSD) has been under selling pressure the past week or so after approaching key price resistance just above 640. It managed to close above its near-term price support so I'd look for a bounce. Here's the chart on the DJUSSD and the chart of Pepsi (PEP), a stock that could benefit from a bounce:
 The DJUSSD has its RSI near key 40 support and its MACD is residing almost squarely on its centerline - both of which can signal a reversal level during an uptrend. PEP bounced nicely off key price support close to 113 and could be primed for another push toward its August high just above 118.
Historical Tendencies
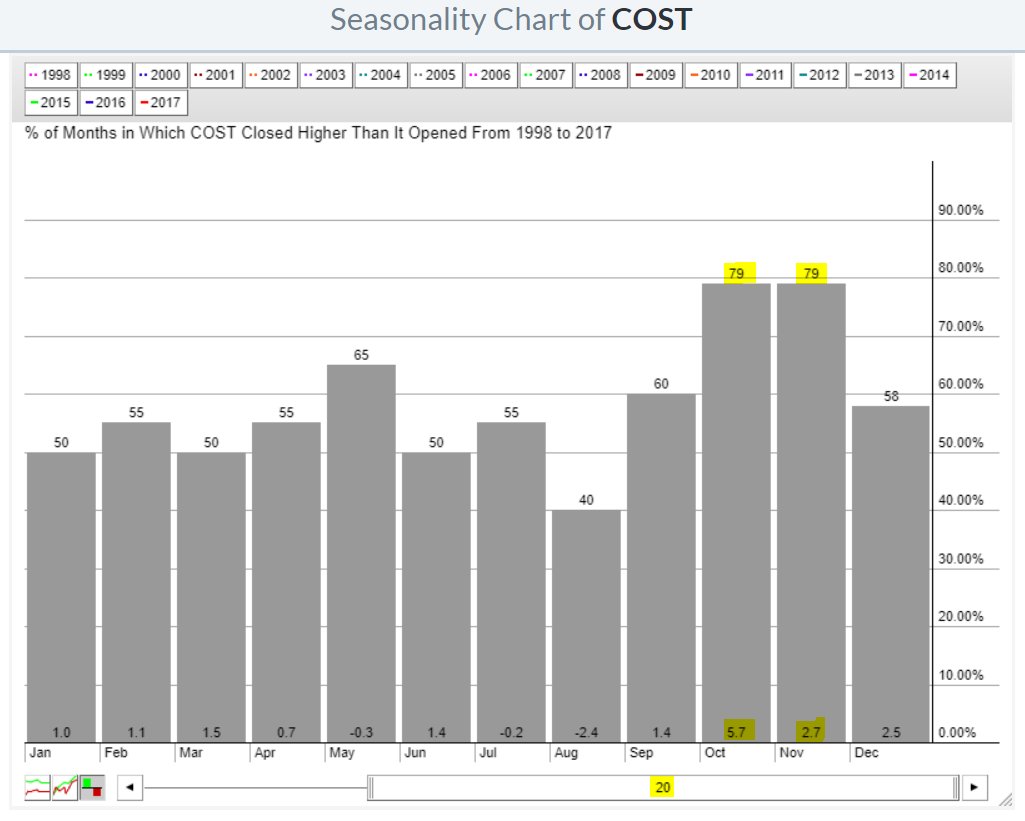
On its weekly chart, Costco (COST) could be starting the right side of a cup as it's begun to trend higher again. Also, there's a trendline that connects price lows in March 2014, August 2015, October 2016 and recent lows in July/August 2017. Adding to the potential end of year bullishness for COST is its seasonal pattern:
 There's a clear bullish bias in October and November and that cannot hurt so long as COST trends higher and remains above its 20 week EMA.
Key Earnings Reports
None
Key Economic Reports
Initial jobless claims released at 8:30am EST: 259,000 (actual) vs. 303,000 (estimate)
September Philadelphia Fed Survey released at 8:30am EST: 23.8 (actual) vs. 18.0 (estimate)
July FHFA house price index to be released at 9:00am EST: +0.4% (estimate)
August leading indicators to be released at 10:00am EST: +0.2% (estimate)
Happy trading!
Tom


