Market Recap for Monday, October 23, 2017
After early strength, Monday was a seller's market. As you might expect on one of the more bearish days of late, defensive sectors showed renewed relative strength with utilities (XLU, +0.05%) and consumer staples (XLP, -0.07%) the two top performing sectors. Consumer discretionary (XLY, -0.68%) and industrials (XLI, -0.63%) were hit the hardest, but the latter group's negative divergence could be problematic if selling continues. Check out the XLI chart:
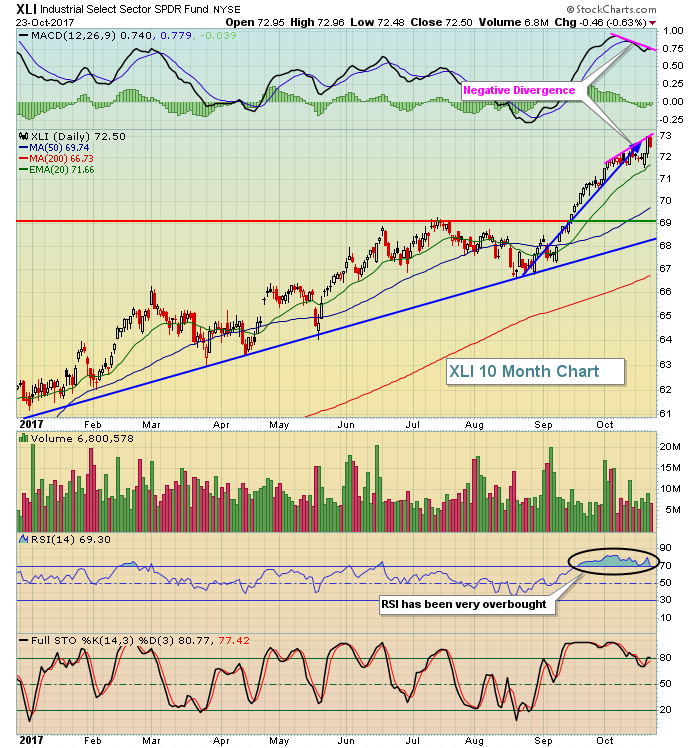 Remaining overbought for a month is a problem. We need to consolidate those gains and the daily negative divergence is alerting us to the fact that price momentum is slowing. While the 20 day EMA typically provides us great support during uptrends, I'd look for further weakness ahead and a potential 50 day SMA test. Be very careful this week.
Pre-Market Action
The U.S. market appears ready to rebound this morning, but most of those futures gains appear to be concentrated in the Dow Jones. The selling on the S&P 500 was somewhat significant yesterday and, after early strength this morning, I'd look for more selling.
Dow Jones futures are up 148 points as we approach the opening bell, lifted by strong quarterly results from Caterpillar (CAT) and 3M (MMM). United Technologies (UTX) and General Motors (GM) also provided solid profits - above expectations. Still, the key today will be whether the broader S&P 500 index can clear Monday highs. That will be a significant test.
Current Outlook
We entered the most bearish historical week of the year on Monday and ended the day about as you might expect - lower. After an opening gap higher, the benchmark S&P 500 moved lower throughout the balance of the session and printed a bearish engulfing candle by day's end. Until we clear the high on Monday, be careful. Here's the chart highlighting this ominous short-term development.
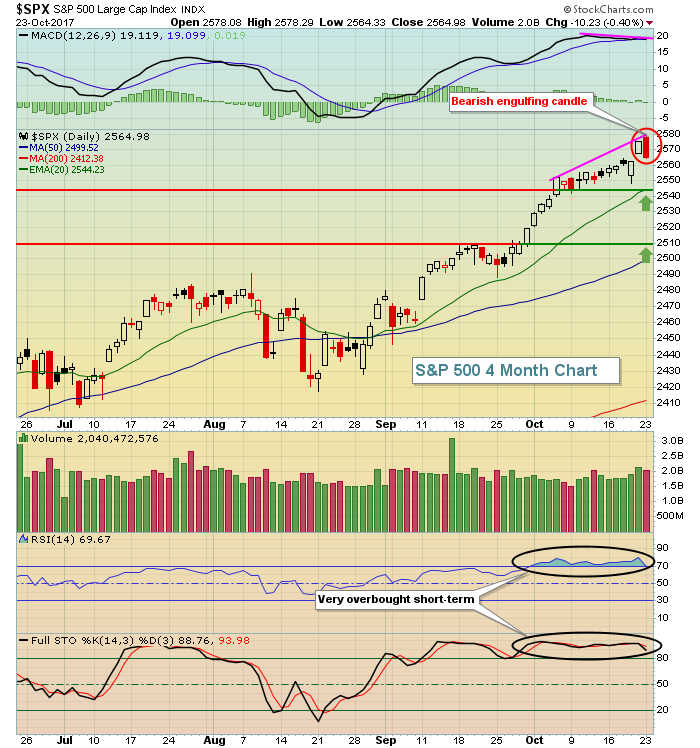 The bearish engulfing candle is ominous all by itself. But throw in the fact that the daily MACD appears to be rolling over with this reversing signal and it suggests this is likely the real deal. Finally, check out the RSI and stochastic. They've both been overbought for the entire month of October. The U.S. stock market has priced in strong earnings and now that we're seeing those positive earnings reports roll in, I believe we could be set up for a "buy on rumor, sell on news" scenario. We'll soon find out as earnings this morning are mostly strong. The two green arrows above are areas of support on the S&P 500 to watch closely. The initial test will be the rising 20 day EMA, currently at 2544. I expect that level to hold, but if it doesn't, then consider price support at 2510. I'll be surprised if any selling takes us beneath that level.
To be very clear, I am very bullish. But it would be healthy to see the market consolidate with some selling and it appears we're set up for that now. As I mentioned earlier, a breakout above Monday's high on the S&P 500 would negate the reversing bearish engulfing candlestick.
Sector/Industry Watch
The Dow Jones U.S. Heavy Construction Index ($DJUSHV) recently broke its downtrend and is now in a confirmed uptrend. It's a group that should be considered on the long side throughout the balance of 2017 and into 2018. Here's the current technical picture:
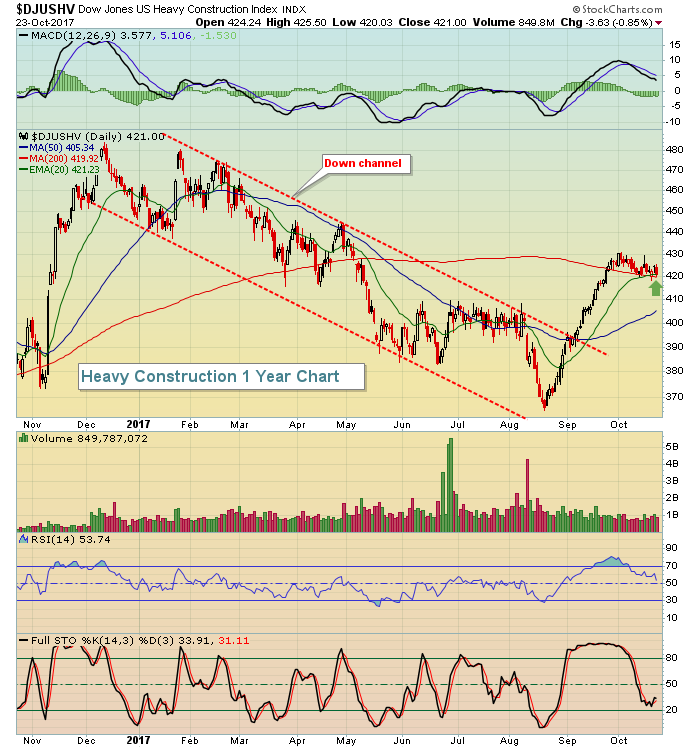 This group had been downtrending throughout most of 2017 before the breakout and subsequent uptrend formed. In addition to a much stronger technical picture, heavy construction historically performs its best in November and December. I feature the seasonal chart on the DJUSHV in the Historical Tendencies section below.
Historical Tendencies
You can see from the chart above that the DJUSHV is looking much better technically now. The group is still down year-to-date, but the improvement the past two months is fairly obvious. Now the DJUSHV will benefit from seasonal tailwinds as reflected below:
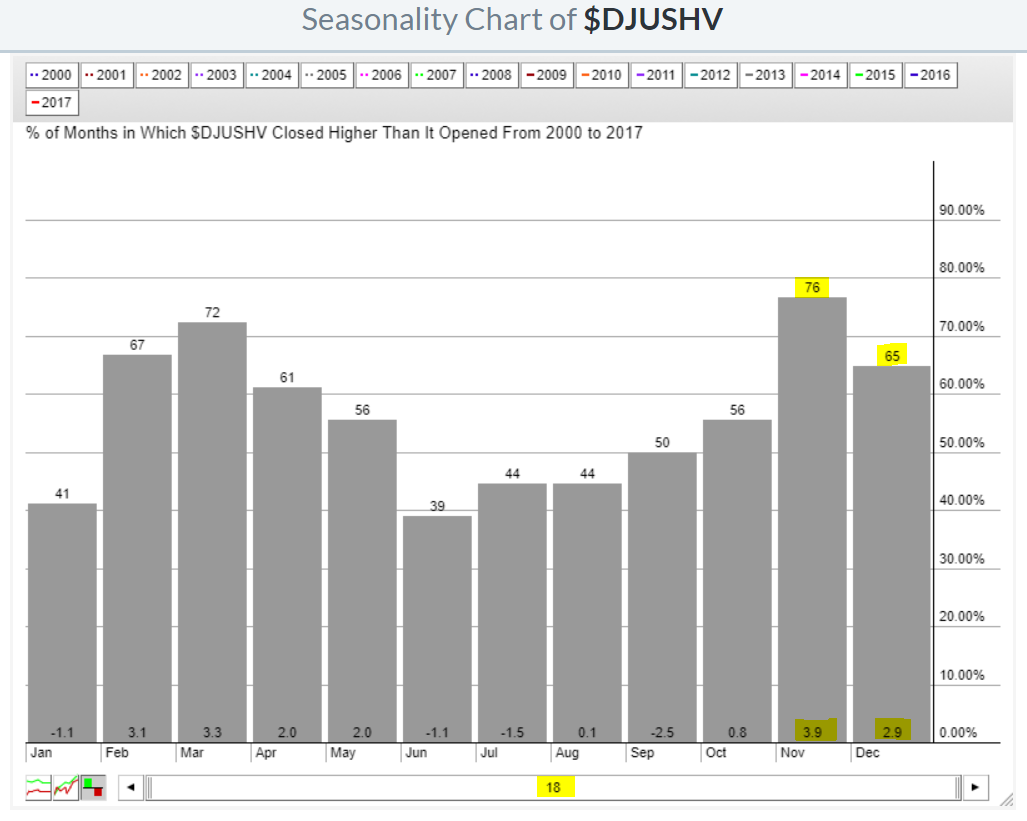 The DJUSHV is poised for further gains as we move toward the end of 2017.
Key Earnings Reports
(actual vs. estimate):
AMTD: .49 vs .46
BIIB: 6.31 vs 5.70
CAJ: .52 vs .38
CAT: 1.95 vs 1.22
FCAU: .58 vs .54
GLW: .43 vs .40
GM: 1.32 vs 1.07
INFY: .25 vs .24
LLY: 1.05 vs 1.03
LMT: 3.24 vs 3.25
MCD: 1.76 vs 1.75
MMM: 2.33 vs 2.21
NVS: 1.29 vs 1.25
PCAR: vs 1.09
SHW: 4.75 vs 4.70
SWK: 1.95 vs 1.87
UTX: 1.73 vs 1.68
(reports after close, estimate provided):
CNI: 1.06
COF: 2.15
DFS: 1.53
ESRX: 1.90
ILMN: .98
T: .75
TXN: 1.12
Key Economic Reports
October PMI composite flash to be released at 9:45am EST: 54.8 (estimate)
Happy trading!
Tom


