Market Recap for Friday, October 20, 2017
Friday was a day of more all-time high closes. It's been quite redundant, but the bulls certainly don't mind. This time we saw leadership from aggressive areas of the market - a very bullish sign indeed. Financials (XLF, +1.18%) and industrials (XLI, +1.08%) were on top of the sector leaderboard from Friday and they'll be looking to sustain gains this week as quarterly earnings reports accelerate.
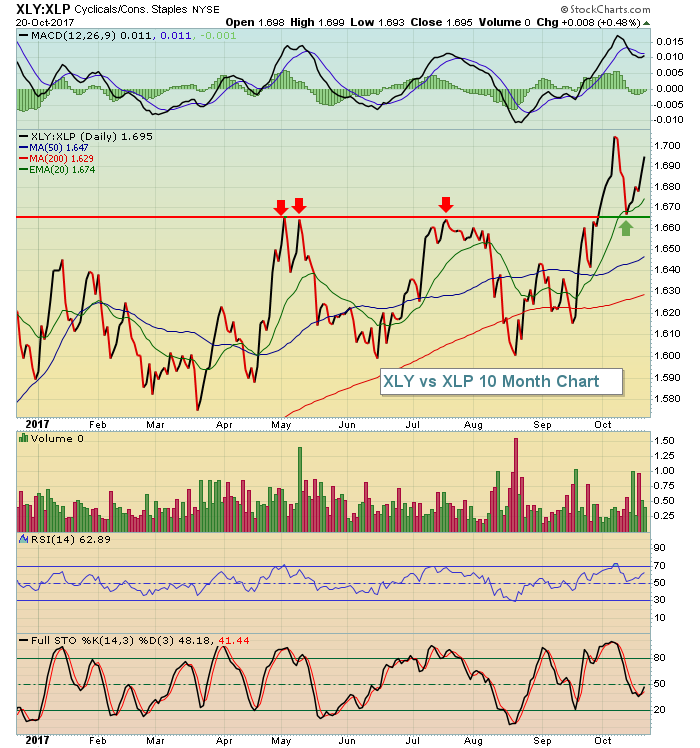
Materials (XLB, +0.86%) and technology (XLK, +0.68%) also performed extremely well to close out last week. Skechers (SKX) had a huge beat with its earnings report, leading the Dow Jones U.S. Footwear Index ($DJUSFT) to a 2.52% rise and that group helped consumer discretionary (XLY, +0.24%) to gains as well, easily outpacing their staples (XLP, -0.24%) counterparts. For those keeping score, the XLY:XLP relative ratio bounced beautifully off relative support and its rising 20 day EMA:
 The all-time record closes on our major indices tells us that we're in a bull market. Charts like the XLY:XLP tell us that we're in a sustainable bull market. So long as money rotates towards offensive areas (XLY, XLK, XLI and XLF) as we break to all-time highs, I'll remain quite bullish.
Pre-Market Action
Futures are slightly higher here in the U.S. this morning, looking to continue its almost unabated push higher this month. Crude oil ($WTIC) is up and pressuring the $52 per barrel level. Gold ($GOLD) is down slightly. Overnight, Tokyo's Nikkei ($NIKK) was up solidly, while Hong Kong's Hang Seng Index ($HSI) was down. European markets are mostly higher this morning and that's aiding the U.S. market as well.
With 30 minutes to go to the opening bell, Dow Jones futures are up 24 points.
Current Outlook
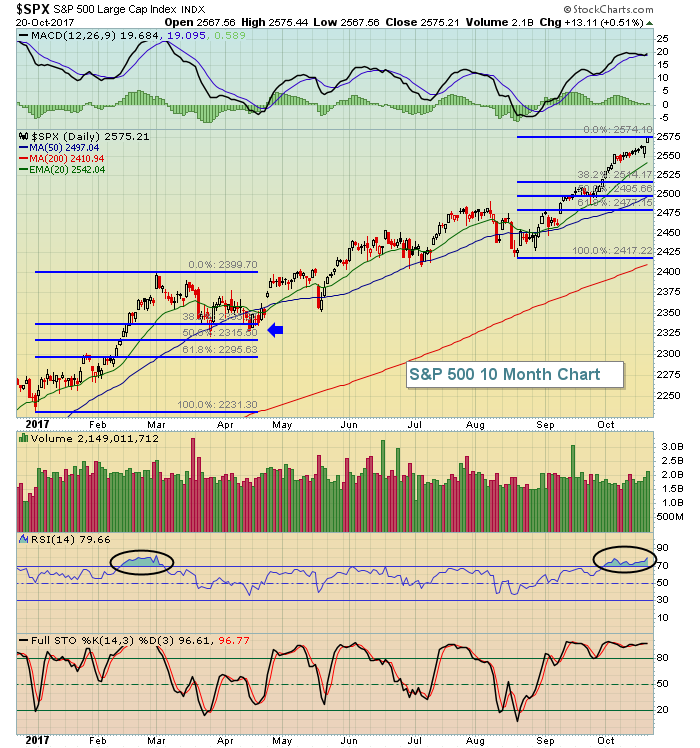
It's difficult to say whether the stock market will react this week in typical bearish fashion. As reflected in the Historical Tendencies section below, this is the worst week of the year from a historical perspective. Furthermore, we're very overbought with an RSI of 80 and stochastic of 97 on the S&P 500 daily chart. Both momentum oscillators have been overbought the entire month of October. Simply put, this bull market rally needs a rest. Here's a chart showing the overbought conditions on the S&P 500:
 The last time the S&P 500 was this overbought, it pulled back into the 38.2%-50.0% retracement zone (blue arrow). We have a similar short-term parabolic move higher, which could use some selling to unwind things a bit. We finished strong on Friday, so there's no signal just yet that we've topped, but keep an eye out for a topping candle. Then a 38.2% retracement, or possibly more, of this latest bull leg higher would be an area to watch for support.
Sector/Industry Watch
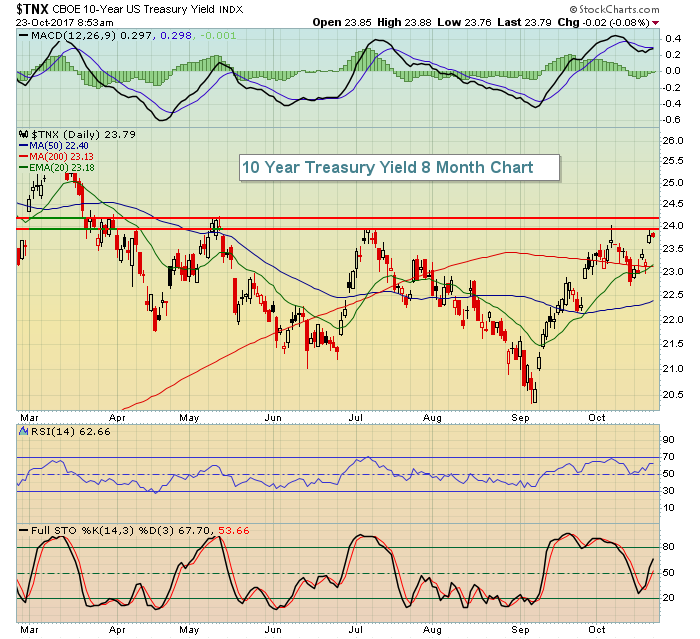
We're a week away from the next FOMC meeting and it's going to be very interesting. I'm keeping a close eye on the 10 year treasury yield ($TNX) as the bond market has a way of predicting Fed moves and a breakout in the TNX above 2.40% resistance would suggest the Fed is ready to hike rates once again. Take a look at the TNX chart:
 Yield resistance is clearly in the 2.40%-2.42% area. A breakout above would suggest a significant rotation from bonds to equities and would likely add more fuel to the already frenzied bull market advance.
Monday Setups
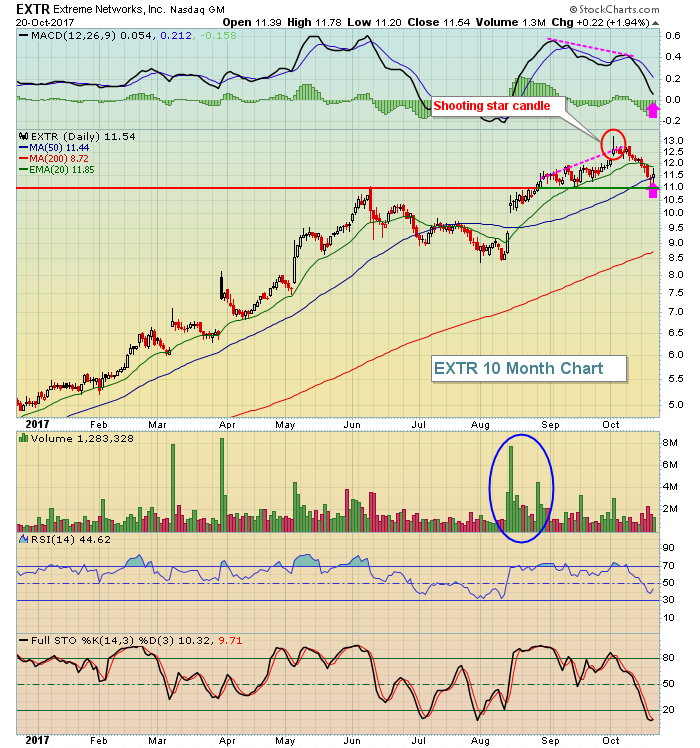
It's difficult to get overly excited about entering or adding to positions when the benchmark S&P 500 is so overbought. However, rotation does take place under the surface so I'd look for recent winners that have pulled back a bit. Let me introduce Extreme Networks (EXTR):
 EXTR printed a reversing candle (shooting star) at its recent high and that accompanied a negative divergence. That combination typically results in weakness and I look for a 50 day SMA test and a MACD centerline "reset". We've seen the 50 day test and we're close to that reset. I like EXTR from here with a possible 2nd entry closer to 11 with a closing stop beneath 10.75 or so. My target would be a move back to the 12.50-13.00 price resistance area to test the early October high.
Historical Tendencies
Here's a repost of the historical information that I provided last week on the NASDAQ (since 1971). This represents the annualized returns for each upcoming calendar day this week:
October 23 (today): -47.98%
October 24 (Tuesday): -60.33%
October 25 (Wednesday): -73.17%
October 26 (Thursday): -73.31%
October 27 (Friday): -91.93%
This bull market definitely has difficult seasonal headwinds to address. Let's see whether the seasonal tendency trumps the solid technical picture. Batter up.
Key Earnings Reports
(actual vs. estimate):
HAL: .42 vs .38
ITW: 1.71 vs 1.65
KMB: 1.60 vs 1.53
STT: 1.71 vs 1.61
TMUS: .63 vs .44
VFC: 1.23 vs 1.12
(reports after close, estimate provided):
ARNC: .27
WHR: 3.90
Key Economic Reports
None
Happy trading!
Tom


