Market Recap for Monday, November 20, 2017
It had been awhile since financials (XLF, +0.46%) and industrials (XLI, +0.45%) were the top two performing sectors during a market session, but that's exactly what we saw on Monday. Welcome back! Both the XLF and XLI had serious momentum issues to deal with on their daily charts as they made their recent price highs. But profit taking and market rotation took care of that and both of these groups now appear poised to rejoin the bull market party.
XLF:
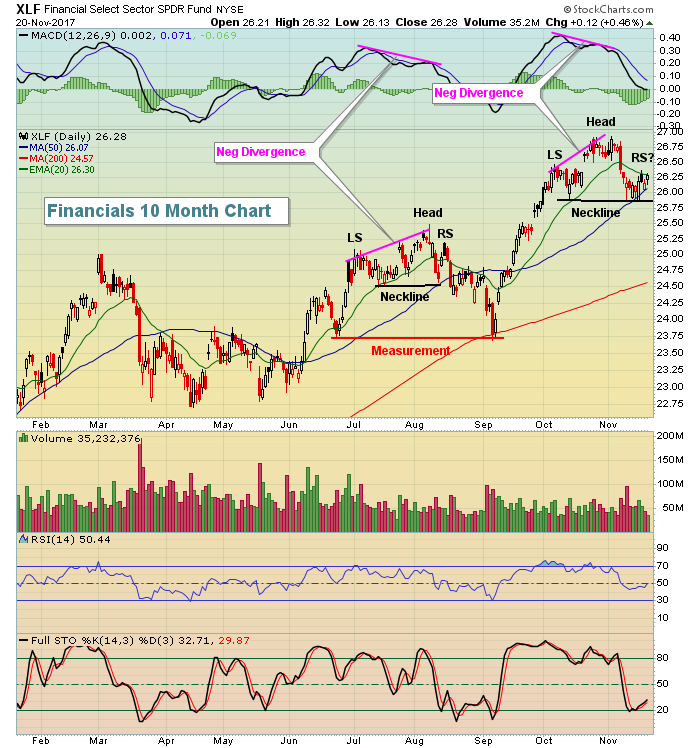 We do need to respect a potential short-term top based on the head & shoulders pattern in play. The pattern doesn't confirm, however, until a break of the neckline support occurs on heavier than normal volume. It would set up more short-term selling and rotation, similar to what we saw in late August into September. I don't expect this pattern to execute, but we do need to be aware of it. A bigger picture head & shoulders is much more bearish and that is discussed in the Current Outlook section below.
Now the XLI:
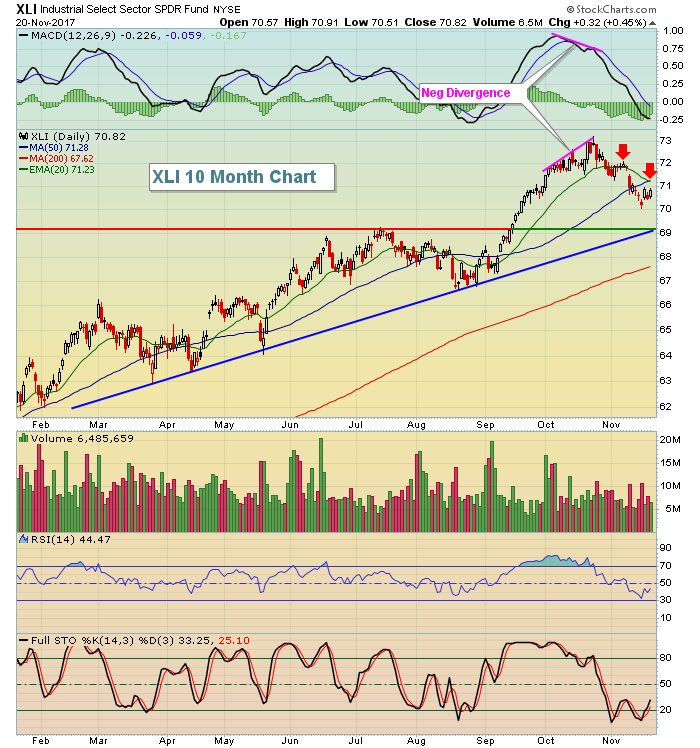 While the strength from the XLF and XLI was certainly welcome on Monday, it by no means suggests that the current rotation away from the two groups is over. While the XLF and XLI charts are set up differently from a technical perspective, both did show the slowing momentum (negative divergence) and both have sold off to their respective 50 day SMAs and we've seen MACD centerline "resets" on both as well. On the XLI, the most solid support is at 69 where we see the intersection of both price support and trendline support. I don't believe we'll move that low, but keep this level in mind. In the meantime, the falling 20 day EMA is now important because the MACD is beneath the centerline and that indicates accelerating selling momentum. If the XLI can negotiate the 20 day EMA and close back above it, chances increase that the short-term selling episode has ended. If it fails there, look below to that 69 support.
Healthcare (XLV, -0.42%) was the worst performer on Monday and the action of late has been bearish as tests to clear the declining 20 day EMA are failing. I discuss the XLV in the Sector/Industry Watch section below.
Pre-Market Action
The 10 year treasury yield ($TNX), gold ($GOLD) and crude oil ($WTIC) are all relatively flat this morning. The only key economic report due out is existing home sales for October, which will be released at 10am EST. There will be a number of key earnings reports out, however, as Salesforce.com (CRM) and Hewlett Packard (HPQ) both report after today's close. Several companies reported this morning and you'll find many in the Earnings Reports section below. Most of the companies reported strong bottom line results, beating Wall Street consensus estimates.
Asian markets were strong overnight, particularly in Hong Kong where the Hang Seng Index ($HSI) gained more than 500 points (+1.91%). Europe is rallying this morning with the German DAX ($DAX) higher by nearly 1%, bouncing off that 12900-13000 support area.
Here in the U.S., Dow Jones futures look to open solidly higher as they're up 108 points with just 30 minutes left to the opening bell.
Current Outlook
Let's take a bigger picture view of the XLF and what we should look for, if we want to consider the group technically from a bearish perspective:
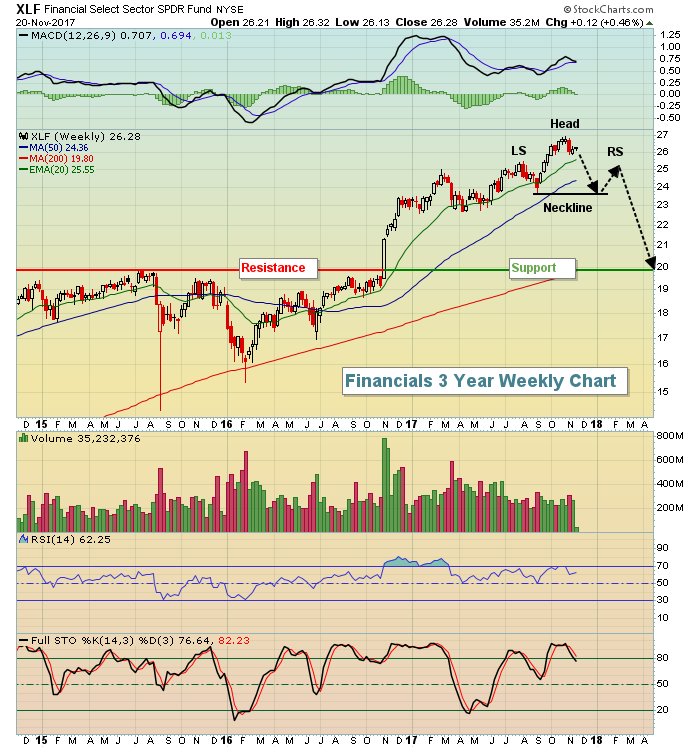 A bigger picture head & shoulders breakdown would actually measure down close to the level of the late 2016 breakout, so should this pattern form, it would be very important to take note of it.
But let me be clear. I don't believe this is what the XLF will do. I remain quite bullish as we complete 2017 and move into 2018. This might be a story for a later day, but I do not believe it will play out according to the above chart. The point here is that breaking intermediate-term support, as opposed to short-term support, would provide much more ammunition for the bears and clearly we'd see much more volatility and emotional trading if the XLF were to take this kind of hit.
Sector/Industry Watch
The healthcare ETF (XLV) still looks good on a weekly chart as it's currently testing its rising 20 week EMA so, in my opinion, I believe healthcare will bounce and participate in rising equity prices through year end and beyond. However, it would not be wise to completely ignore the recent failures in the short-term:
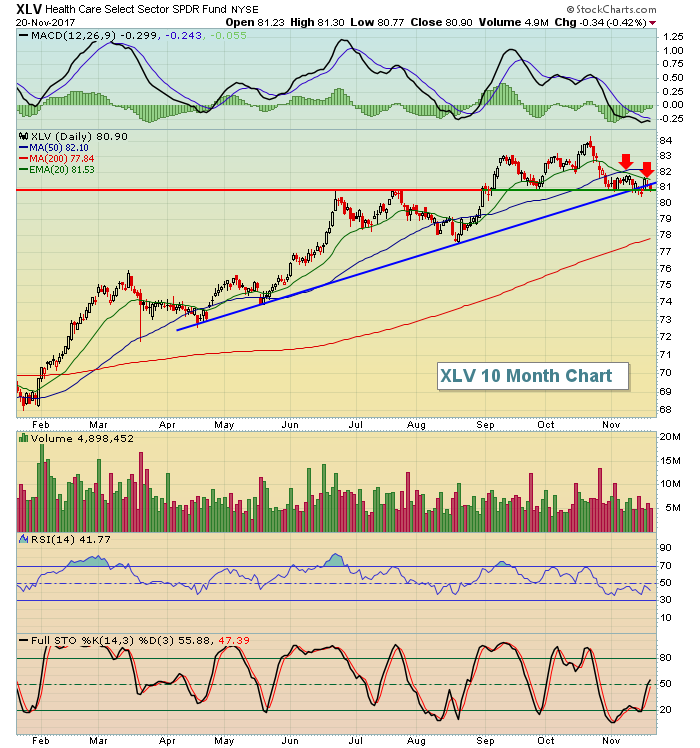 Trendline support appears to be just above 81, although trendlines are very subjective. Should we connect the tails? The candle bodies? Still, it's fairly apparent to me that trendline support is very close to price support, which is very easy to define. The July high was just below 81 so, after that was cleared, it became price support. We've tested that level on a couple of occasions and we're at that key level again. Also note the red arrows that mark the declining 20 day EMA. The XLV continues to fail there. A close above the 20 day EMA would be the initial bullish sign to look for. Obviously, a break beneath the recent price low would be a bearish development.
Historical Tendencies
U.S. equities are on the verge of entering one of their most bullish periods of the year. Since 1971, the NASDAQ has produced annualized returns of +51.97% from November 23rd through December 5th.
Key Earnings Reports
(actual vs. estimate):
ADI: 1.45 vs 1.37
BURL: .70 vs .65
CPB: .92 vs .97
DLTR: 1.01 vs .90
HRL: .41 vs .40
JEC: .98 vs .82
LOW: 1.05 vs 1.02
MDT: 1.07 vs .99
(reports after close, estimate provided):
CPRT: .26
CRM: .37
HPE: .28
HPQ: .44
Key Economic Reports
October existing home sales to be released at 10:00am EST: 5,440,000 (estimate)
Happy trading!
Tom


