Market Recap for Friday, November 17, 2017
It was an interesting day on Friday. While most of our major indices struggled and finished in negative territory with the Dow Jones, S&P 500 and NASDAQ falling 0.43%, 0.26% and 0.15%, respectively, the Russell 2000 continued its torrid advance of late, rising another 0.40%. The Russell 2000 had lagged the other major indices quite significantly from early October through last Tuesday, but it reversed just as it approached key price, moving average and Fibonacci support at 1450 on Wednesday. It then embarked on a three day advance where, at its high on Friday, had rebounded nearly 3%. The S&P 500, by contrast, had risen by less than 1%.
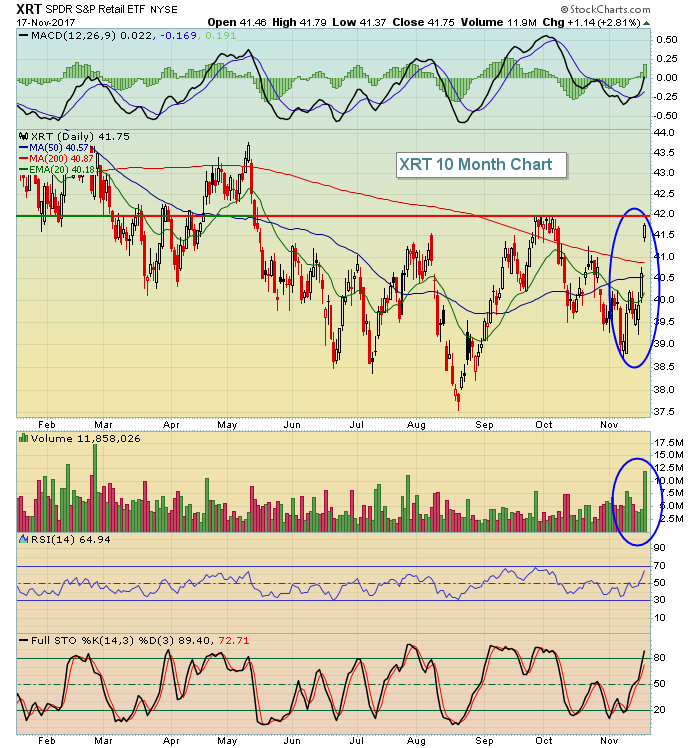
Energy (XLE, +0.49%) and consumer discretionary (XLY, +0.44%) led the action on Friday. Retail stocks (XRT, +2.81%) have soared over the past few trading sessions, aiding the small cap index and consumer discretionary. If the XRT can break above 42.00 it would represent a 6 month high. The XRT closed at 41.75 on Friday:
 Retail stocks haven't seen this much buying at any point in 2017 and that is very bullish for the consumer discretionary space, where the XLY has broken out above a key triple top that printed in June, July and October. I look for continued outperformance of the XLY (vs. the benchmark S&P 500) into year end and 2018.
Pre-Market Action
We're seeing mostly fractional gains across the globe last night and this morning. Dow Jones futures are following a similar path, up 23 points with a little more than 30 minutes left to the opening bell.
Crude oil ($WTIC) is down fractionally, but still trading above $56 per barrel. Gold ($GOLD) is down slightly to $1292, but it had a very strong session on Friday (+1.43%) to approach the $1300 level.
Current Outlook
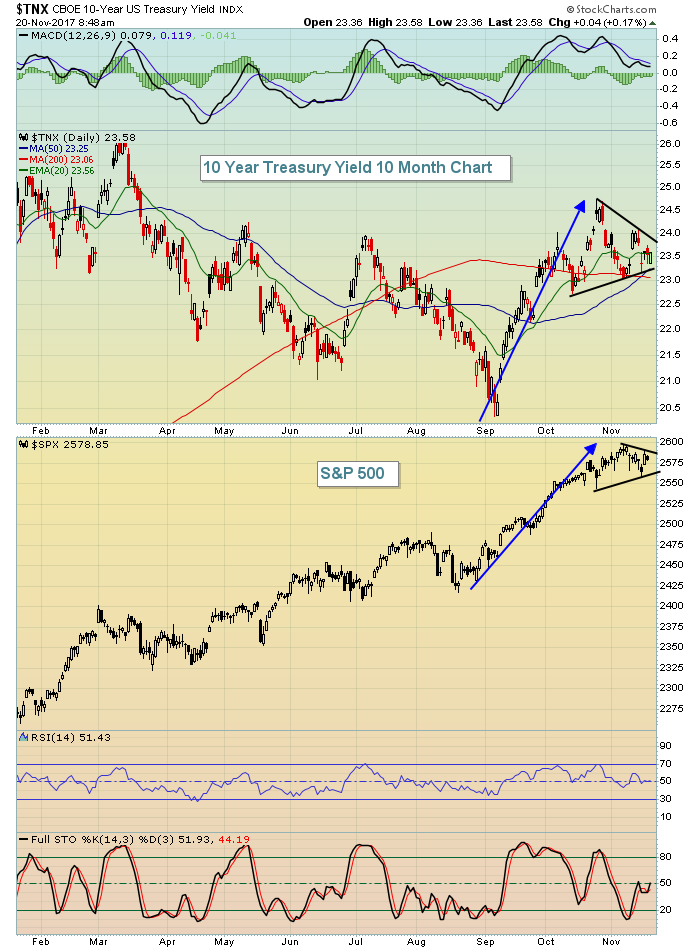
The benchmark S&P 500 has moved mostly sideways over the past few weeks as the bond market tries to decide which way treasury yields are heading. The indecision on the 10 year treasury yield ($TNX) is pretty easy to visualize as yields meander back and forth, squeezing inside a symmetrical triangle:
 While there's certainly not a 100% positive correlation here, rising yields do tend to coincide with rising equity prices. The reason? Rising yields always coincide with falling treasury prices. The proceeds from selling treasuries typically results in the buying of equities, especially during a bull market. So I'll be watching to see if the TNX breaks to the upside of its current symmetrical triangle pattern. That'll provide a clue of another corresponding rise in U.S. equities.
Sector/Industry Watch
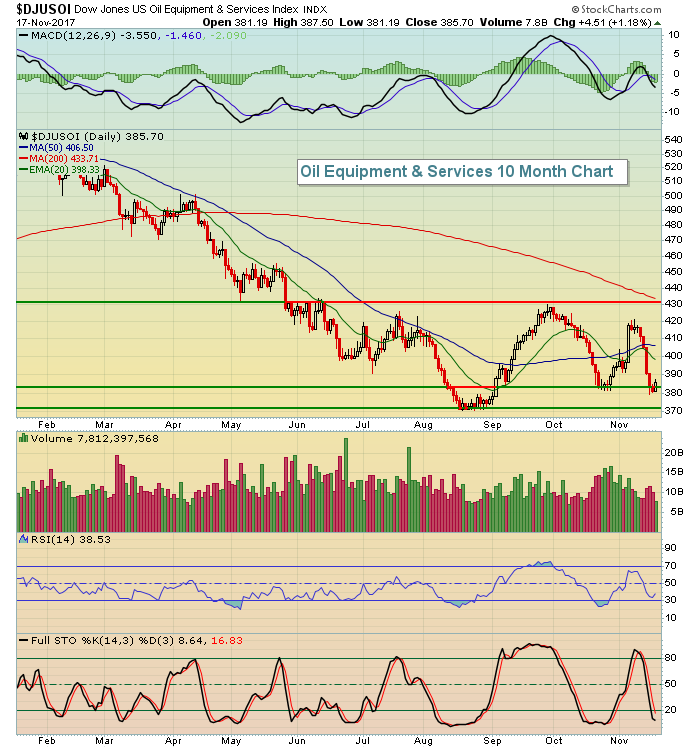
While energy (XLE) has recovered well off its lowest levels in August, the Dow Jones U.S. Oil Equipment & Services Index ($DJUSOI) has failed to do the same and isn't far from yet another breakdown. If energy is truly going to recover in the longer-term, it'd be technically helpful for the DJUSOI to participate:
 The key trading range is from 370-430. While the reward to risk favors the long side in this group right now, be careful if volume accelerates and price support close to 370 is lost.
Monday Setups
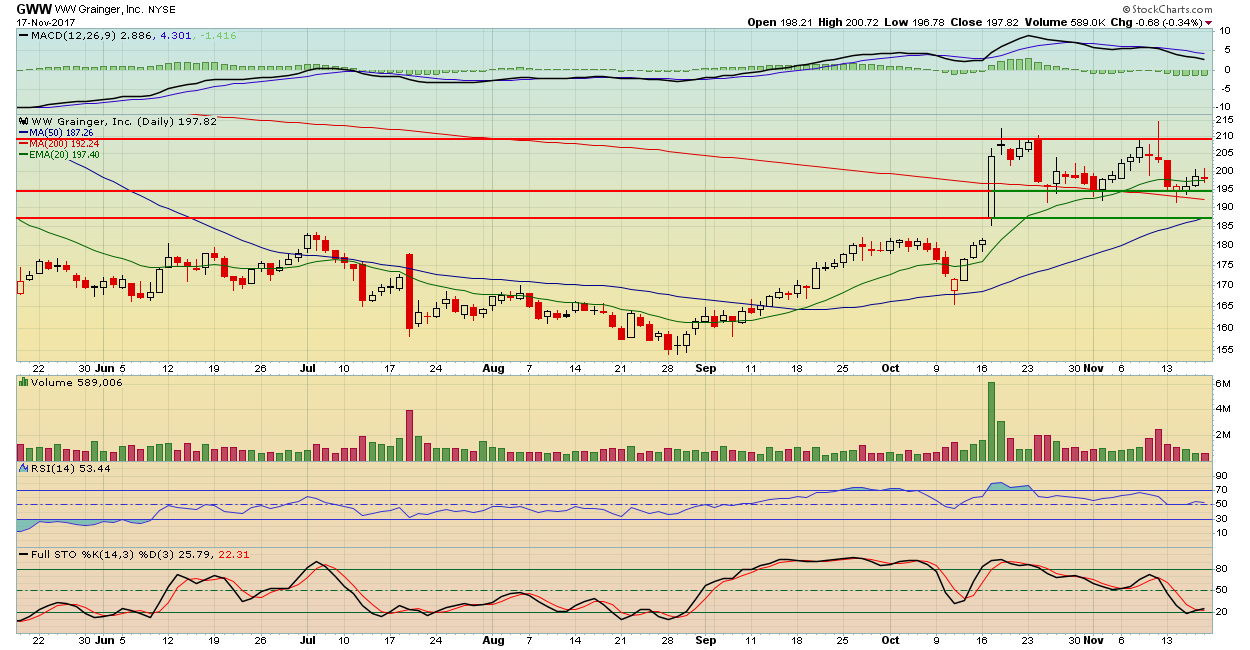
Every Monday I provide several trade setups that look interesting to me and that generally are at or approaching price levels that offer bullish reward to risk entries. You can see all of my setups for this week by CLICKING HERE. Today I'm featuring WW Grainger (GWW), which soared after its earnings were released in mid-October. At the time, GWW had become very stretched and overbought. I added it to my Strong Earnings ChartList here at StockCharts and I've been stalking it ever since. It seems to have established a fairly solid floor with its recent lows and its RSI has fallen from the 80s down to 53 - a much better RSI level for entry:
 Best entry would be another test in the low- to mid-190s as that's where buyers have appeared in recent weeks. I'm not completely ruling out a quick drop to test the top of gap support near 188 so building a position in GWW on weakness makes sense. I'd look to the 210-215 area for initial profits.
Historical Tendencies
It's Thanksgiving Week here in the U.S. with the markets closed on Thursday. The stock market has an abbreviated session on Friday, closing three hours early at 1pm EST. While Black Friday will be shortened and the volume will likely be very light, history tells us that it's a great day to own stocks. Since 1950, the Friday after Thanksgiving has produced annualized returns of +86.83% on the S&P 500. Over the past 67 years, the S&P 500 has climbed higher 49 times on Black Friday. That's a solid winning percentage, though certainly not a guarantee.
In most years, however, it helps to pay for that big turkey dinner! :-)
Key Earnings Reports
(reports after close, estimate provided):
A: .63
INTU: .05
PANW: .68
VIPS: .15
Key Economic Reports
October leading indicators to be released at 10:00am EST: +0.6% (estimate)
Happy trading!
Tom


