Market Recap for Thursday, November 16, 2017
U.S. indices spiked sharply higher on Thursday's open in contrast to many recent days where the bulls have found themselves underwater in early action, trying to reclaim control of the action throughout the balance of the session. Yesterday, there wasn't a battle. The bulls won decidedly and with one day of solid gains, the benchmark S&P 500 is within earshot of 2600 and another all-time high. But the big winner among the major indices was the Russell 2000 ($RUT, +1.56%), whose swift march higher reversed several days' worth of selling. While the NASDAQ's gain of 1.30% resulted in a fresh all-time high close, technically the RUT's big day was more impressive because it held on to a very critical support level before its big rise:
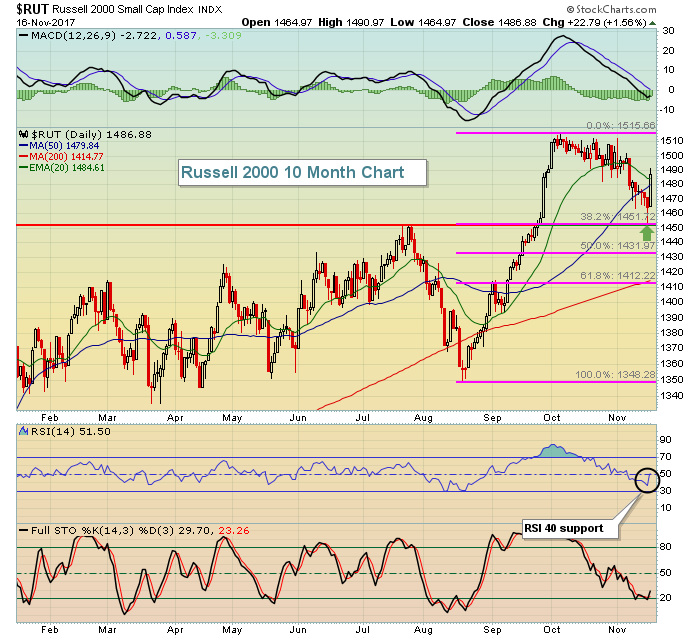 While it's great to point this out after it occurs, technical analysis provides us the ability to "forecast" this type of price behavior before it happens. In my November 8th article, "Russell 2000 Takes Biggest Hit In Three Months; Watch This Support Level", I pointed out that price support, 20 week EMA support and Fibonnaci 38.2% retracement support all coincided just above the 1450 level. Therefore, entry at that level (IWM is the ETF that tracks the Russell 2000) was the best reward to risk entry level as you would expect to see various types of buyers stepping up as the RUT neared 1450. Simply put, technical analysis works to manage risk. I'm not going to tell you that technical analysis is 100% correct because it's not. But it absolutely helps to manage risk and that's why I use it.
Technology (XLK, +1.40%) and consumer staples (XLP, +1.38%) - an odd combination - were the primary beneficiaries of Thursday's bullish action. Seven of nine sectors advanced, so there was plenty of participation. Utilities (XLU, -0.32%) and energy (XLE, -0.40%) were the two sectors that failed to participate. The XLU's failure to participate is discussed further in the Current Outlook section below.
Food products ($DJUSFP) helped to provide support to the consumer staples sector and this group is showing signs of bottoming. Price and volume trends seem to be turning more bullish and it's occurring after a positive divergence printed on the September low:
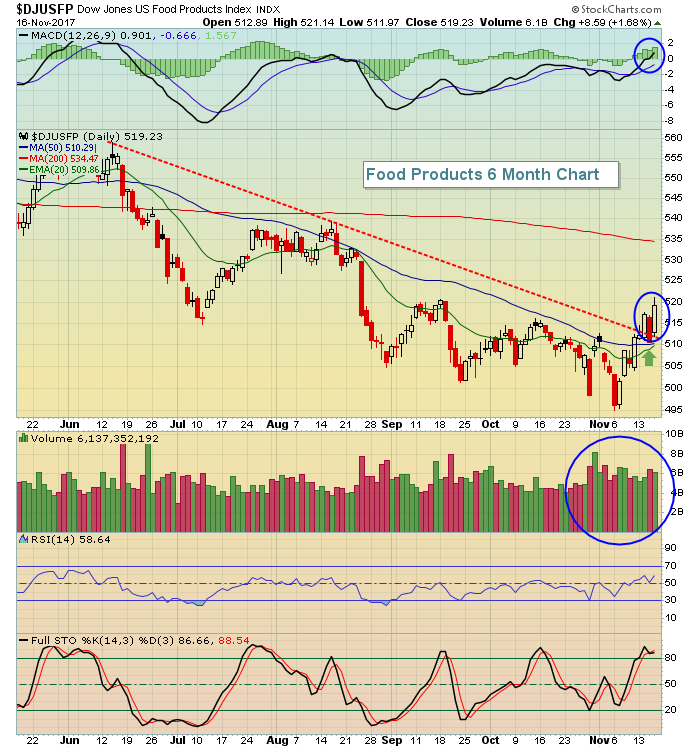 The downtrend line has been broken and the recent test of the rising 20 day EMA held. Volume trends are strengthening and a bullish MACD crossover suggests accelerating price momentum. Clearing the September high just above 520 will be the next priority.
Pre-Market Action
In a week full of economic reports, things have slowed down considerably this morning. October housing starts and building permits both were reported above expectations so it'll be interesting to see how the Dow Jones U.S. Home Construction Index ($DJUSHB) responds. This group seems to be pausing after earlier good news this week and it could be a simple case of "buy on the rumor, sell on the news". If the DJUSHB doesn't rise today on the back of excellent housing starts, then we're probably looking at a short-term top with rotation away from housing stocks until we see a rising 20 day EMA test.
After some recent selling, crude oil ($WTIC) is up 1.40%. I expect that will help energy shares (XLE) to rebound after a rough 7-8 trading sessions. The timing is good because price support on the XLE in the 66.50-67.00 was being challenged.
Asian markets were mixed, but mostly higher overnight. This morning, European markets are also mostly higher. the German DAX ($DAX) reversed after testing its rising 50 day SMA for the first time since breaking above that key moving average in early September.
Dow Jones futures are down slightly (45 points) as U.S. stocks attempt to build on solid Thursday gains. NASDAQ futures show a slightly positive level on the heels of a very solid earnings report from Applied Materials (AMAT).
Current Outlook
Utilities (XLU) lost some of their zest the past two days as the group works off short-term overbought conditions. A bearish dark cloud cover candle printed on Wednesday, which looks somewhat similar to the reversing bearish engulfing candle that we saw at the early September high - with one major difference. First, let's look at the chart:
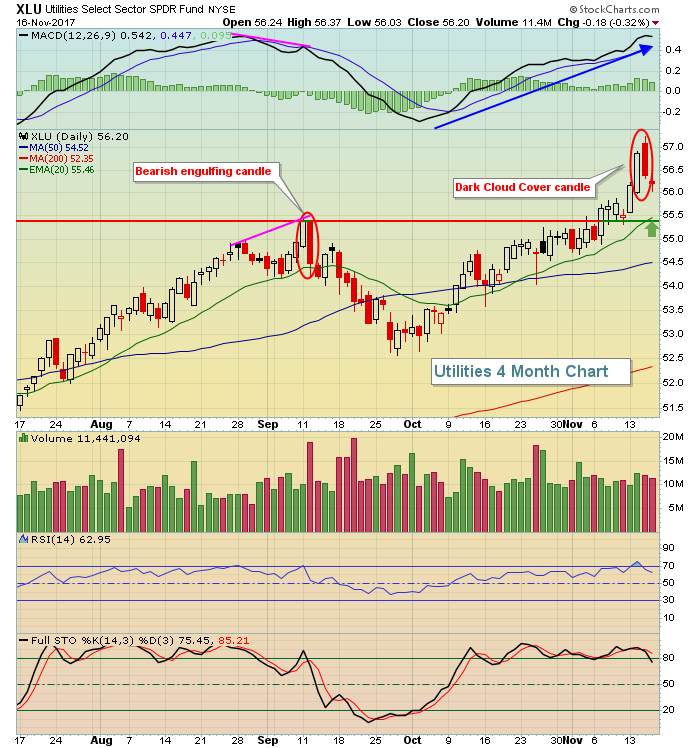 While I didn't highlight it on the above chart, RSI had hit the mid-70s a couple trading sessions ago and needed a rest. The difference between now and early September, however, is that there's no sign of slowing price momentum currently. In September, that reversing candle coincided with a nasty negative divergence. It's not unusual for the rising 20 day EMA to offer up little support when price momentum is slowing. Currently, though, the MACD is quite strong and both price support and the rising 20 day EMA intersect in the 55.40-55.50 range.
Should the XLU weaken further, look to that area for a possible turning point.
Sector/Industry Watch
Mobile telecommunications ($DJUSWC) was a big reason for technology's outperformance yesterday, but this group is far from being bullish. While the group gained 4.46% on the session, there still remain significant technical hurdles ahead:
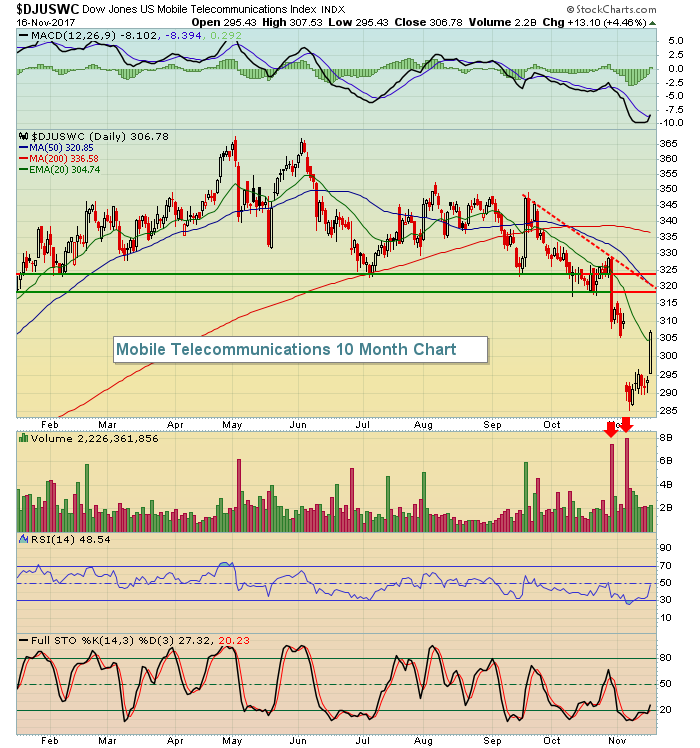 That huge advance came out of nowhere. The industry was clearly oversold with an RSI in the 20s, but the size of the rally was surprising, to say the least. Still, those red arrows show that heavy volume accompanied the recent selling so it still appears to me that distribution continues to take place so I'd look for more selling if the DJUSWC reaches overhead price and trendline resistance in the 318-323 zone.
Historical Tendencies
Since 1950, here's the historical breakdown on the S&P 500 during November:
November 1-15: +23.12%
November 16-30: +17.77%
While the second half of many calendar months perform much weaker than the first half, that's not really the case in November as both halves perform much better than the average 9% annual return that the S&P 500 has typically enjoyed throughout the past 67 years.
Key Earnings Reports
(actual vs. estimate):
FL: .87 vs .80
Key Economic Reports
October housing starts released at 8:30am EST: 1,290,000 (actual) vs. 1,190,000 (estimate)
October building permits released at 8:30am EST: 1,297,000 (actual) vs 1,250,000 (estimate)
Happy trading!
Tom


