Special Note
First, I'd like to wish everyone a Happy New Year! Let's make 2018 our best yet! Here are a couple of quick reminders:
(1) If you like my Trading Places blog and you'd like to follow my articles every morning, scroll down to the bottom of this article, type in your e-mail address and click on the green "Notify Me!" button. You'll then become a (FREE!) subscriber and my article will be sent to the email address you provide IMMEDIATELY after I publish it. As always, thanks for your loyalty and readership, it's much appreciated!
(2) Join Erin Swenlin and me every day the stock market is open on MarketWatchers LIVE. It's a fast-paced internet show that'll keep you up-to-date on the latest news and charts. While the news is important, the charts are more important as technical price action typically leads fundamental news. You can join the show by CLICKING HERE anytime after 11:45am EST. The show runs from noon to 1:30pm EST every day, Monday through Friday. Today will include our popular "Monday Setups" (yeah, I know it's Tuesday today) where Erin and I will each provide our favorite trade setup for the week. Also included will be the segment "10 in 10", which is covered at 12:50pm EST every day. In this segment, I take your requests and attempt to annotate 10 stocks in 10 minutes! It's always a challenge, but it's fun, educational and perhaps our most popular segment each day.
I hope to see you there later today!
Market Recap for Friday, December 29, 2017
Action recently has been rather boring as many market participants were on vacation for the holidays. Friday wasn't much of an exception, although selling did grip the market in the final hour on Friday to take all of our major indices into negative territory to close out 2017.
Utilities (XLU, +0.06%) was the only sector to finish higher, no doubt inspired by the inability of the 10 year treasury yield ($TNX) to sustain its earlier upside momentum. The TNX finished last week more than 5 basis points below where it started and that spurred some defensive buying late last week.
Because of the inability to sustain higher treasury yields, it should be no surprise that financials (XLF, -0.71%) took the brunt of the selling with banks ($DJUSBK) falling nearly 1%.
Pre-Market Action
U.S. stocks are poised to begin 2018 the way they traded throughout much of 2017 - higher. Dow Jones futures are up 113 points with a little more than 30 minutes left to the opening bell.
Overnight in Asia, the Hang Seng Index ($HSI) spiked more than 500 points, easily clearing the 30,000 level and rapidly approaching its all-time high of 31,958.41, set in 2007. The rest of Asia was mostly mixed.
In Europe, the German DAX ($DAX) is struggling and threatening to break below its support range of 12800-12900. The balance of European stocks are also primarily negative.
Netflix (NFLX) was upgraded this morning and it looks to open firmly higher. NFLX has a long history of performing extremely well in January and it looks to begin 2018 in similar fashion.
Current Outlook
To determine underlying strength in bull markets, I look to one of my favorite charts. It's very simple and easy to generate on StockCharts. It simply prints the benchmark S&P 500 on an absolute basis and then look at the longer-term relative trend of each aggressive sector vs. this benchmark index. Rising relative ratios mean that money is rotating into aggressive sectors, while a declining ratio would suggest the opposite. Rising relative ratios typically result in sustaining bull markets. Take a look at this long-term chart:
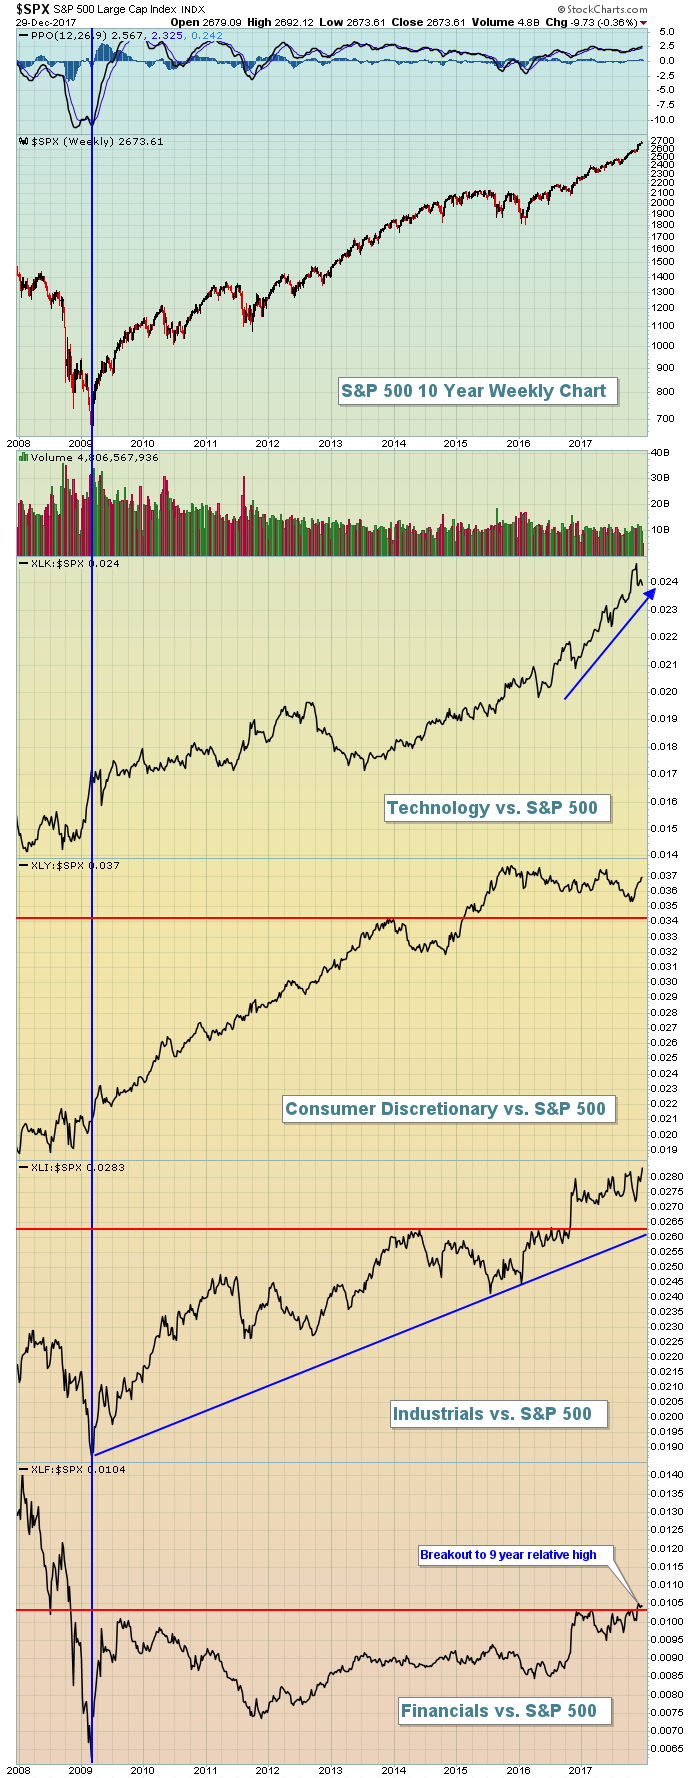 As the S&P 500 reaches new heights, there is little indication at this moment that we're on the final legs of the current 9 year bull market. I'm actually seeing signs telling me exactly the opposite - that the currnent bull market will continue in 2018 amid higher treasury yields and historically low expected volatility readings. Bear markets typically require storm clouds brewing and I simply don't see any. But remember that we began 2007 in pretty decent shape, yet a bear market began in October of that year. So we'll clearly need to remain on our toes, but as we begin 2018, I'm not changing anything in my trading strategy. For those unfamiliar with my trading style, I'm a short-term trader, rarely holding positions for more than a month or two. I look to trade momentum and right now I have a ton of choices.
Sector/Industry Watch
I've highlighted below in the Historical Tendencies section that the retail ETF (XRT) tends to perform very well from February through April, but that January can be troublesome. Negative divergences are confirming that we could be in for a rough start to the year for retail, although I'm a fan of this group in 2018:
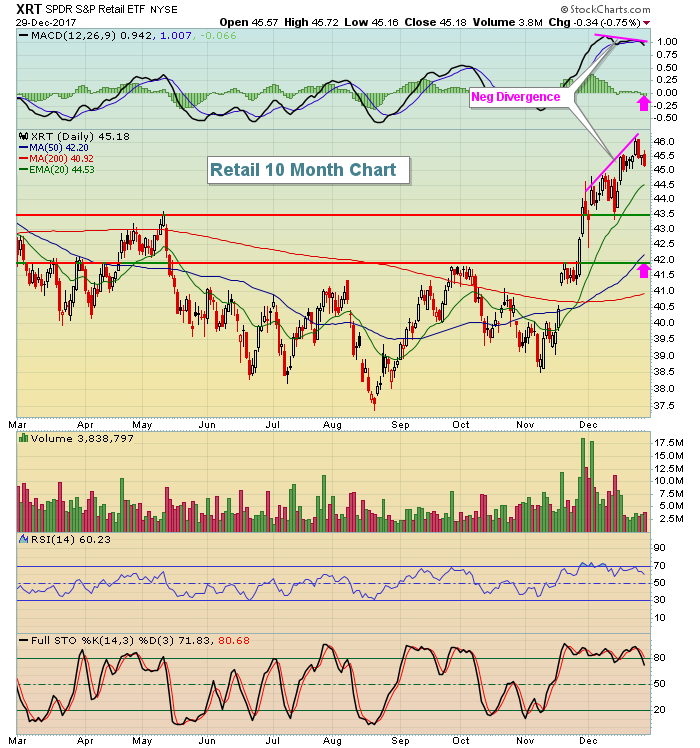 When prices rise to set new highs, but the MACD rolls over, it's an indication of slowing price momentum. Now the 20 day EMA becomes even more important. Loss of that key moving average on a closing basis would likely lead to price support tests at 43.50 and possibly 42.00. The XRT would be a very strong reward to risk trade at these price levels.
Monday Setups
Well, for the second straight week, there was no Monday trading. Therefore, I suppose I have a Tuesday setup for you instead. Broadcom (AVGO) is in a very solid reward to risk setup currently. One month ago, AVGO was at its high with an RSI above 70, but after a month of selling and consolidation, AVGO is 10% cheaper, its RSI is at 42 and solid price support is near:
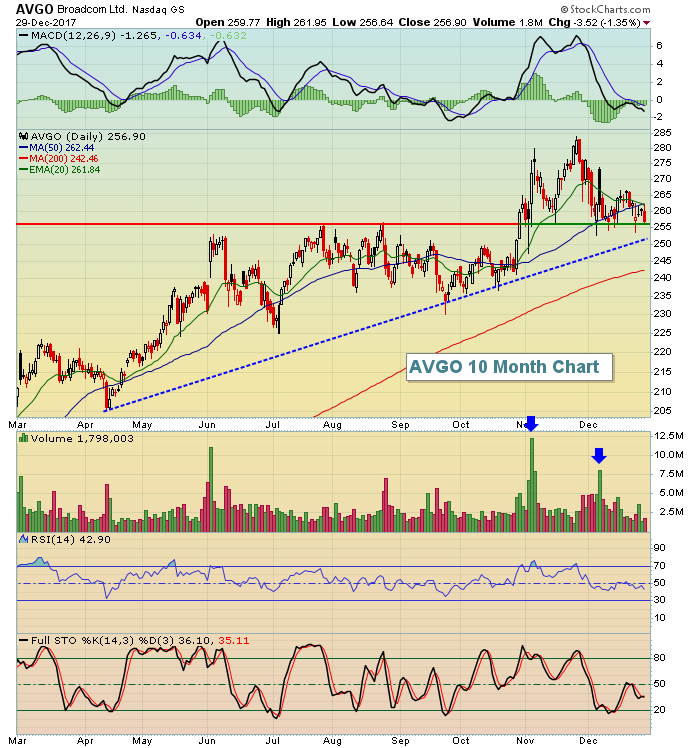 Volume trends remain strong on AVGO so I'd look for a reversal back to the upside fairly soon. I like entry from current price to low-250s, a closing stop just beneath trendline support and an ultimate target back at that November high.
For the rest of my setups for this week, you can CLICK HERE.
Historical Tendencies
Retail stocks (XRT) caught fire at the end of 2017. Historically speaking, I doubt we've seen the highs on this rally. January can be rough on retail stocks, but the February through April period is clearly the best three consecutive months on the calendar for this group. Here are the average monthly returns on the XRT from now through April:
January: -1.2%
February: +3.0%
March: +4.4%
April: +2.8%
On the surface, this may not look that bullish. But keep in mind that the XRT is comprised of a lot of retail stocks. It's extremely diversified within retail and no one stock is a major component of the index. So while the average monthly returns above may not "wow" you, there'll probably be many stocks within this space that soar between now and April.
Key Earnings Reports
None
Key Economic Reports
December PMI manufacturing index to be released at 9:45am EST: 55.0 (estimate)
Happy trading!
Tom


