Special Note
Happy New Year to all and thanks so much for your support of me and StockCharts.com in 2017 (and please subscribe at the bottom of my article - it's FREE!). If you're not a member, your first resolution should be to become one. There's not a better time than now, before the holiday special ends! It's FREE to begin your one month trial. Just keep in mind that you'll have to extend your membership with an annual extension by December 31st in order to get your two additional free months that are currently being offered. It's a great deal and an awesome way to begin 2018!
Market Recap for Thursday, December 28, 2017
Eight of nine sectors finished higher yesterday as the bulls were able to regain control of the action and send the Dow Jones to a new all-time high close. The S&P 500 fell 2 1/2 points shy of its record high close, while the Russell 2000 closed less than a point away from its all-time high. 2017 has been a very solid year for global equities and the U.S. has been no exception.
Materials (XLB, +0.45%) was again one of the sector leaders with non-ferrous metals ($DJUSNF), aluminum ($DJUSAL) and steel ($DJUSST) leading the charge as they have throughout the past month, gaining 3.10%, 4.44% and 0.53%, respectively, during yesterday's session and 35.60%, 25.03% and 15.17%, respectively, over the past month. The monthly action on the DJUSST is quite interesting:
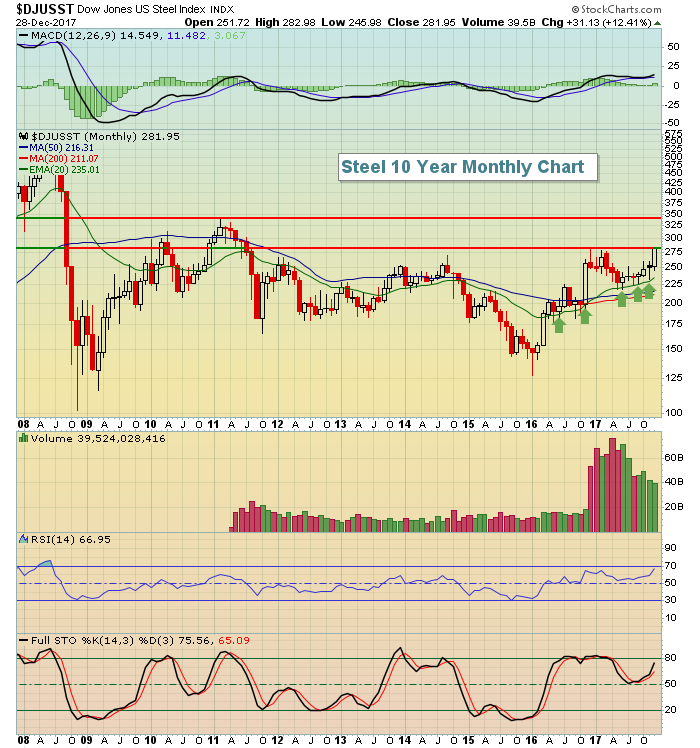 While I'd expect at least a bit of short-term consolidation or profit taking in non-ferrous metals and aluminum, the chart here on steel looks more bullish to me as rising 20 month EMAs continue to provide excellent support.
Pre-Market Action
Gold ($GOLD) has moved back above $1300 and crude oil ($WTIC) is trading above $60 per barrel in early action today. We haven't seen the latter climb above $60 per barrel since mid-2015 - and that was very briefly.
U.S. futures are showing strength as we head into the final trading session of 2017. Despite historical tendencies (see Historical Tendencies section below) that show we typically encounter headwinds to close out a year, Dow Jones futures are higher by 75 points with 30 minutes left before the final opening bell of the year.
Current Outlook
Here's another new year's resolution. Always follow the trend until there's no more trend. I've heard countless times since the 2009 bottom that the bull market ended. Really? Take a look at the S&P 500 chart:
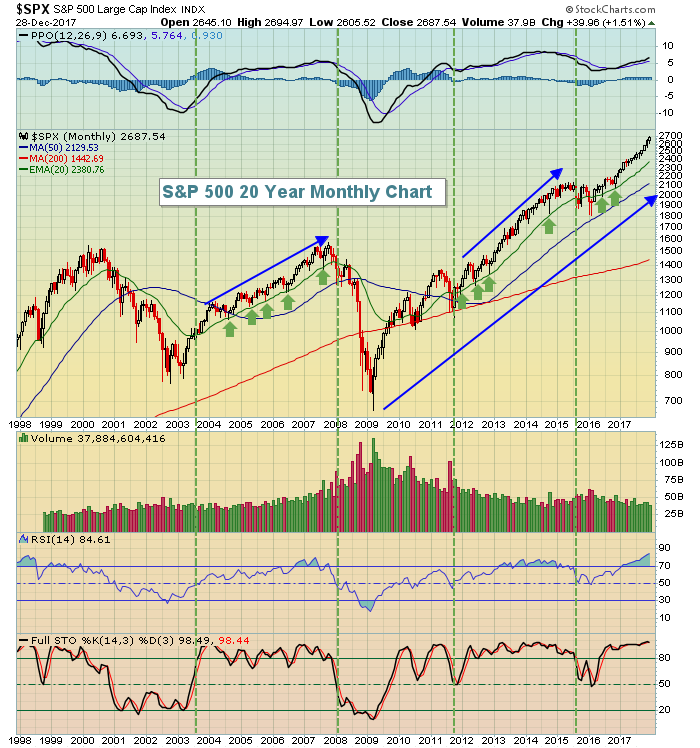 Are we in a bull market? Seriously, is this even a question that needs answering? Whether you understand the reasons for it, the stock market is absolutely on fire and sitting back and waiting for the next bear market is not a great strategy when prices are rising without pause. I noted the last two periods when the S&P 500 index moved back above its 20 month EMA (periods between the green vertical lines). Note that we had a 4 1/2 year period from mid-2003 to the end of 2007 without an S&P 500 monthly close beneath its 20 month EMA. From late-2011 through mid-2015 we saw the same thing - nearly a 4 year period without a 20 month EMA failure. We began our last such move above the 20 month EMA in early-2016 so we've yet to trade two years above this 20 month EMA. Is this latest move higher just beginning? I could argue that it is. Obviously, the best long-term entry point into this bull market would be after a 10% correction where the S&P 500 would trade much closer to its 20 month EMA, but how long will that take? Can you afford not to invest in one of the best bull markets of our time?
Sector/Industry Watch
To maximize gains, I'd consider a third new year's resolution - spot the industry groups that are reversing technically before the crowd does. You can usually do this by watching downtrends break on the weekly chart. In other words, industry groups that previously were downtrending and trading beneath their 20 week EMAs frequently will reverse course and begin to trade above those key moving averages. Catching that move early can be particularly rewarding. I posted a chart on the brewers ($DJUSDB) on Wednesday. Here's another industry to keep a close eye on:
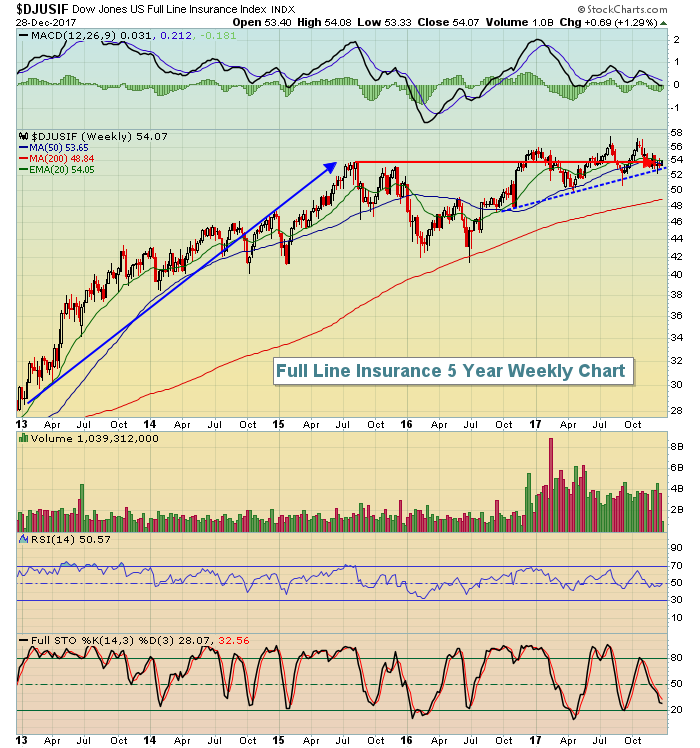 In the four aggressive sectors - technology (XLK), financials (XLF), industrials (XLI) and consumer discretionary (XLY) - there were only five industry groups that fell in 2017 trading. Full line insurance ($DJUSIF) was one of those groups and as you can see from the chart above, the group is currently trading exactly where it was to start the second half of 2015. That's 2 1/2 years of nothing while the bull market has raged on. The recent lows are trending higher, however, so a breakout above recent price resistance from 56-58 would be bullish for the group and could lead to outperformance in 2018.
Historical Tendencies
The last trading day of the year has not been kind this century as the NASDAQ has traded lower on the final session of the year 14 times in the past 17 years. The Russell 2000, which tends to be very bullish in December, has also struggled on the final trading session of the year, losing ground in 12 of the past 17 years.
Key Earnings Reports
None
Key Economic Reports
None
Happy trading and Happy New Year!!!
Tom


