Market Recap for Friday, February 23, 2018
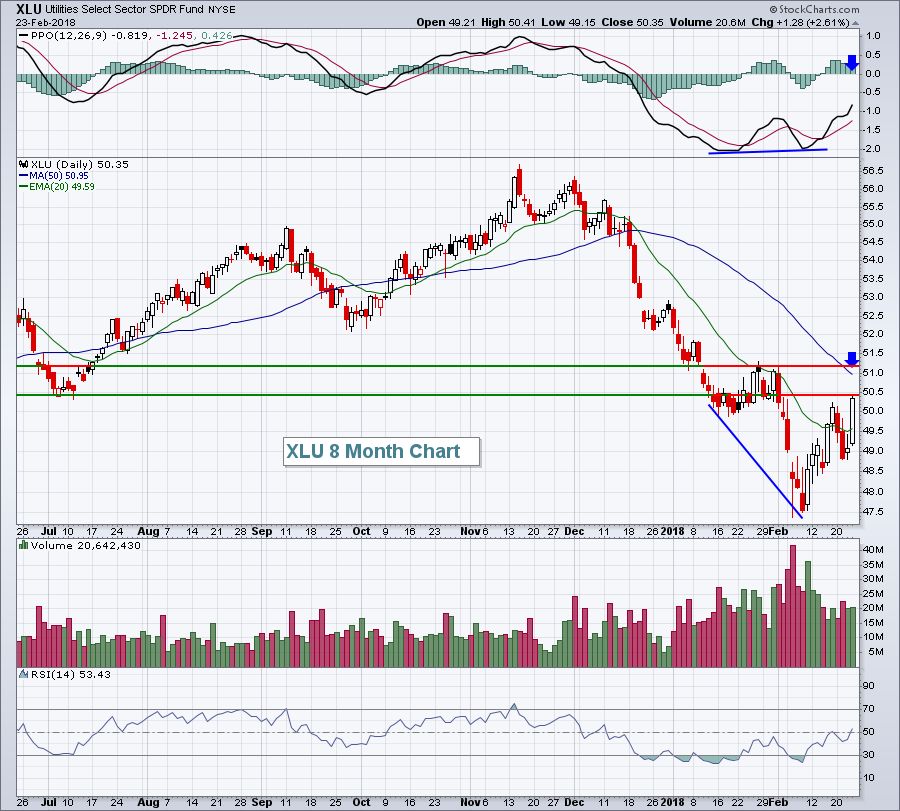
After a steady diet of afternoon flops recently, our major indices soared into Friday's close, clearing important overhead resistance in the process. All major indices finished with 1% gains or more, setting the stage for what could be a very solid week ahead. The NASDAQ gained 1.79% to lead the charge, but there was a solid 1.60% advance on the S&P 500 as well. All nine sectors participated in Friday's rally, a bullish sign indeed, although utilities (XLU, +2.61%) were atop the leaderboard, benefiting from a 5 basis point drop in the 10 year treasury yield ($TNX). This strength was expected as I had discussed last week. A positive divergence was in play on the XLU and a trip to 51.00-51.25 seemed rather likely:
 Energy (XLE, +2.17%) and technology (XLK, +2.09%) were also among the leaders on Friday with the XLE bouncing off key price support in the 66.00-67.00 range. Meanwhile, software stocks ($DJUSSW) helped to lift technology shares as this group quietly nears yet another record breakout:
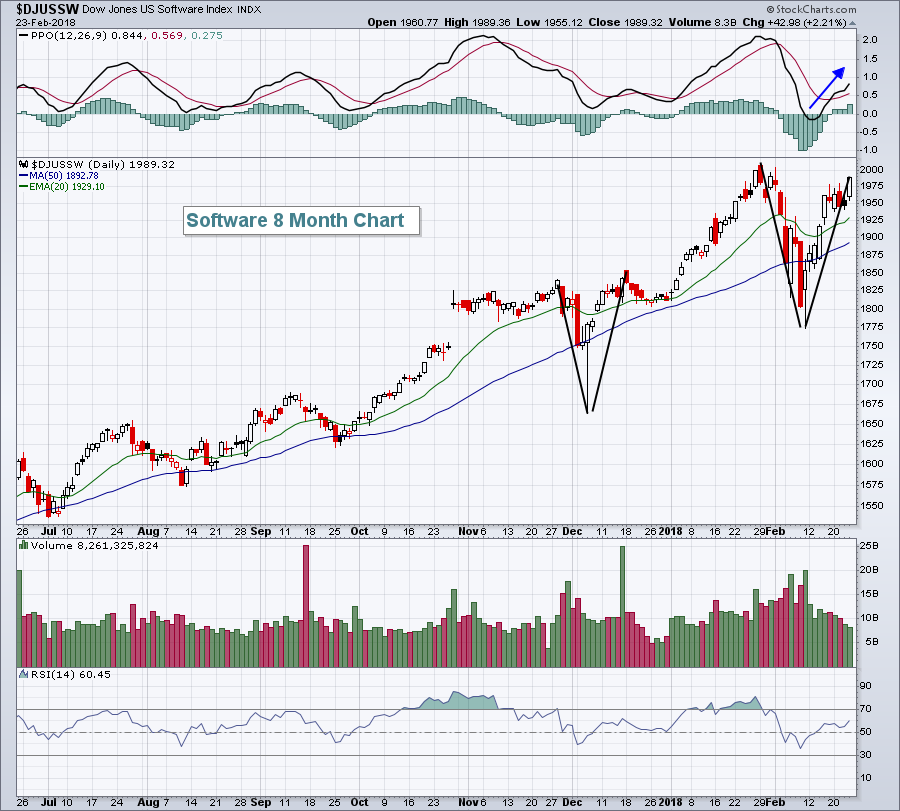 Price momentum here is accelerating as evidenced by the rising PPO off of its recent centerline test. And while many market pundits are arguing against a "V" bottom recovery, there are plenty of examples of exactly that - with software a perfect illustration above.
Pre-Market Action
There's a lot of "green" to open up this trading week. Most global markets are higher with Asian shares gaining overnight and that strength carrying over into Europe this morning. The 10 year treasury yield ($TNX) has slipped back to 2.84% after threatening 3.00% last week. That seems to have lifted traders' spirits as we open a fresh trading week.
Dow Jones futures are higher by 131 points with less than an hour to the opening bell.
Current Outlook
I highlighted the "V" market recovery in the software group in the Market Recap section above. Well, the benchmark S&P 500 could be in the midst of its own V bottom. After being stymied at its 61.8% Fibonacci retracement level, the S&P 500 broke above that level at Friday's close with futures this morning pointing to more strength in early trading. Here's a refresher on that Fib chart:
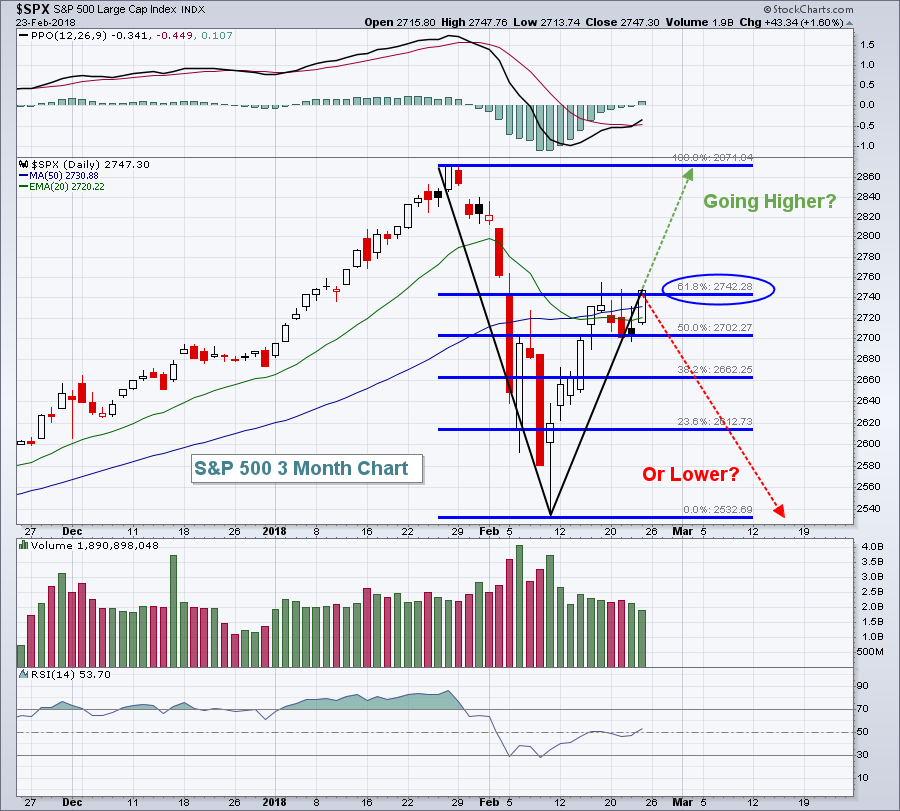 I'm in the "Going Higher" camp after Friday afternoon's strong action. The 2741-2743 level was a clear "line in the sand" in my view. Moving above that level also cleared both the 20 and 50 day moving averages for the second time. Typically in a downtrend, a false breakout above those key moving averages would result in much more selling. But instead, the S&P 500 rallied above both again - a bullish development.
What might change my mind? A heavy volume reversing candle (bearish engulfing?) and a surging VIX that holds 16 support. Otherwise, I'll maintain my short- and long-term bullish bias. Either way, I'll maintain my long-term bias, so the big question in my mind is the short-term direction.
Sector/Industry Watch
The Volatility Index ($VIX) fell 12% on Friday and closed at 16.49, its lowest level since the panicked selloff began in early February. A move on the VIX below 16 would certainly provide one more bullish clue as the prior two bear markets never recorded a VIX reading beneath 16. Here's a long-term view of the S&P 500 and the VIX:
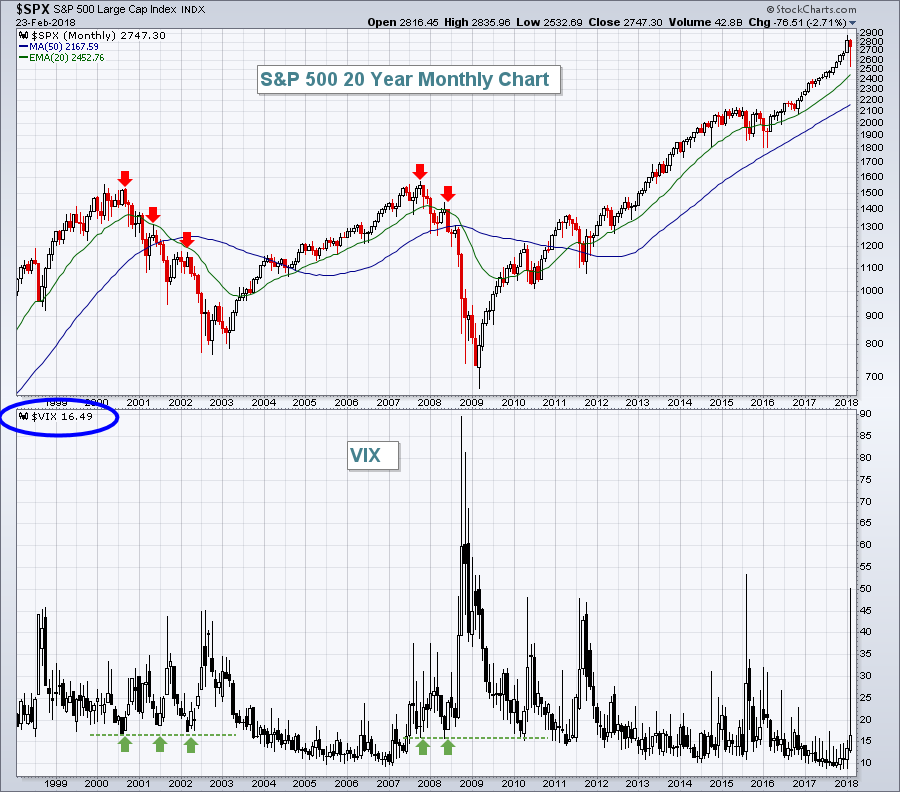 The stock market needed a correction.....and it received one. It was scary because we hadn't seen this type of volatility in the past couple years. A bear market requires certain elements with one being fear. We saw the fear escalate, which aided the bears temporarily. If the VIX moves back below 16, however, the only real evidence of a potential bear market will be gone. Bear markets typically see slowing momentum on long-term charts. I don't see that. They also typically see defensive posturing. And I don't see that.
I'm not saying this cannot be a bear market as the stock market can fool us any time it likes, but the mountain of evidence, in my view, fully supports the notion of a continuing bull market. We could have experienced a V bottom, but I fully expect that we'll see further consolidation. It may require sideways consolidation of some fashion - rectangular, ascending triangle, something.
Monday Setups
Urban Outfitters (URBN) made a solid breakout on Friday after consolidating for several weeks. Here's the chart:
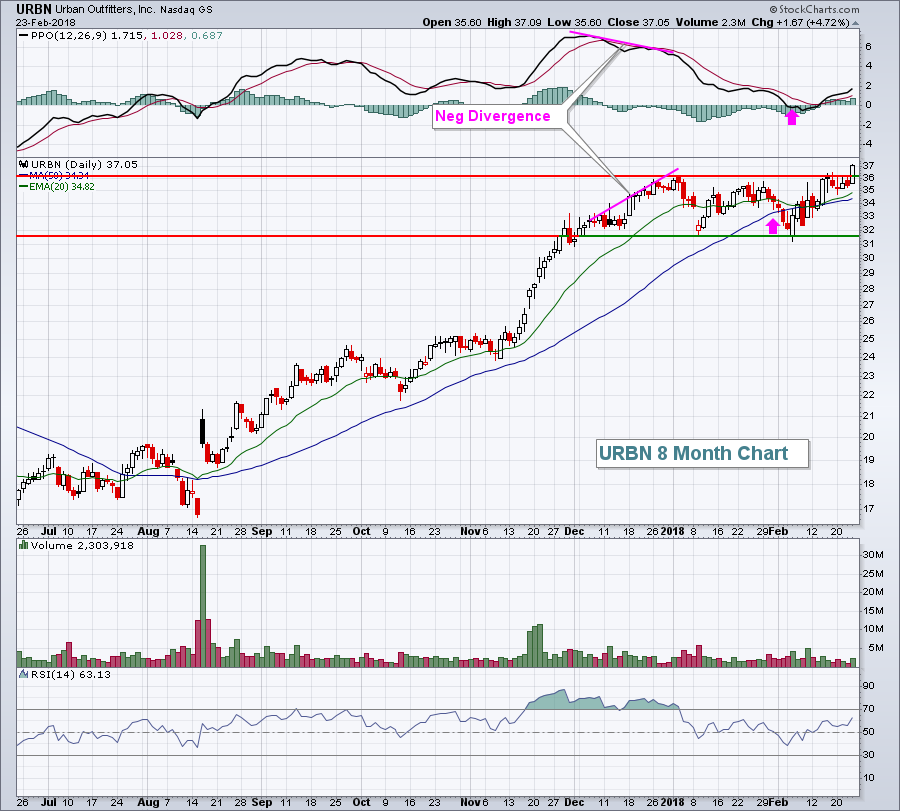 The negative divergence suggested that URBN would consolidate for awhile as its PPO retreated back toward centerline support and price action moved down to test its 50 day SMA (pink arrows). That slowing momentum issue has been resolved and URBN broke out on Friday. I'd look for further strength down the road and consider using the rising 20 day EMA as a closing stop.
I'll be looking to add additional trade setups in my Trading Places blog later this morning. You can access those setups by CLICKING HERE.
Historical Tendencies
Heading into February, I pointed out two stocks - Adobe Systems (ADBE) and priceline.com (PCLN) - that historically performed well in the Febuary-March time frame. Both are up in February 2018, with ADBE breaking out to an all-time high on Friday on expanding volume.
So what works well in March?
Well, for starters, both ADBE and PCLN tend to keep their winning ways intact in March. If you're looking for others, consider Ulta Beauty (ULTA), which has moved higher 90% of the time during March. Its average return for the month of 8.9% leads all NASDAQ 100 stocks. The negative? It only has 12 years of history, not the full 20 years that I like to see. Still, the track record is awesome.
DISH Network Corp (DISH) is another to consider. Its chart has been quite weak, but there's a positive divergence on its weekly chart and it's fairly close to key intermediate- to long-term support. Knowing that DISH has averaged gaining 8.1% over the past 20 years in March doesn't hurt either.
It's also noteworthy that Apple, Inc.'s (AAPL) second best calendar month over the past 20 years has been March, where it's averaged gaining 6.7%. Only October's average gain of 7.5% has been stronger.
Key Earnings Reports
(reports after close, estimate provided):
OKE: .51
PANW: .79
SBAC: .18
SNI: 1.21
Key Economic Reports
January new home sales to be released at 10:00am EST: 600,000 (estimate)
Happy trading!
Tom
