Market Recap for Thursday, February 22, 2018
U.S. indices continued to tread water on Thursday, with mixed action among our major indices and sectors. The Dow Jones posted a triple digit gain (165 points), but the more aggressive NASDAQ and Russell 2000 indices both fell fractionally. Volatility ($VIX) subsided a bit with the VIX falling roughly 6.5% back to 18.72. While the VIX has settled down a lot from the 50 level that we witnessed earlier in February, it remains elevated and should be respected. Another rapid selloff remains possible and we know that during such periods, the baby can be thrown out with the bath water. Very few stocks are insulated from panicked selling.
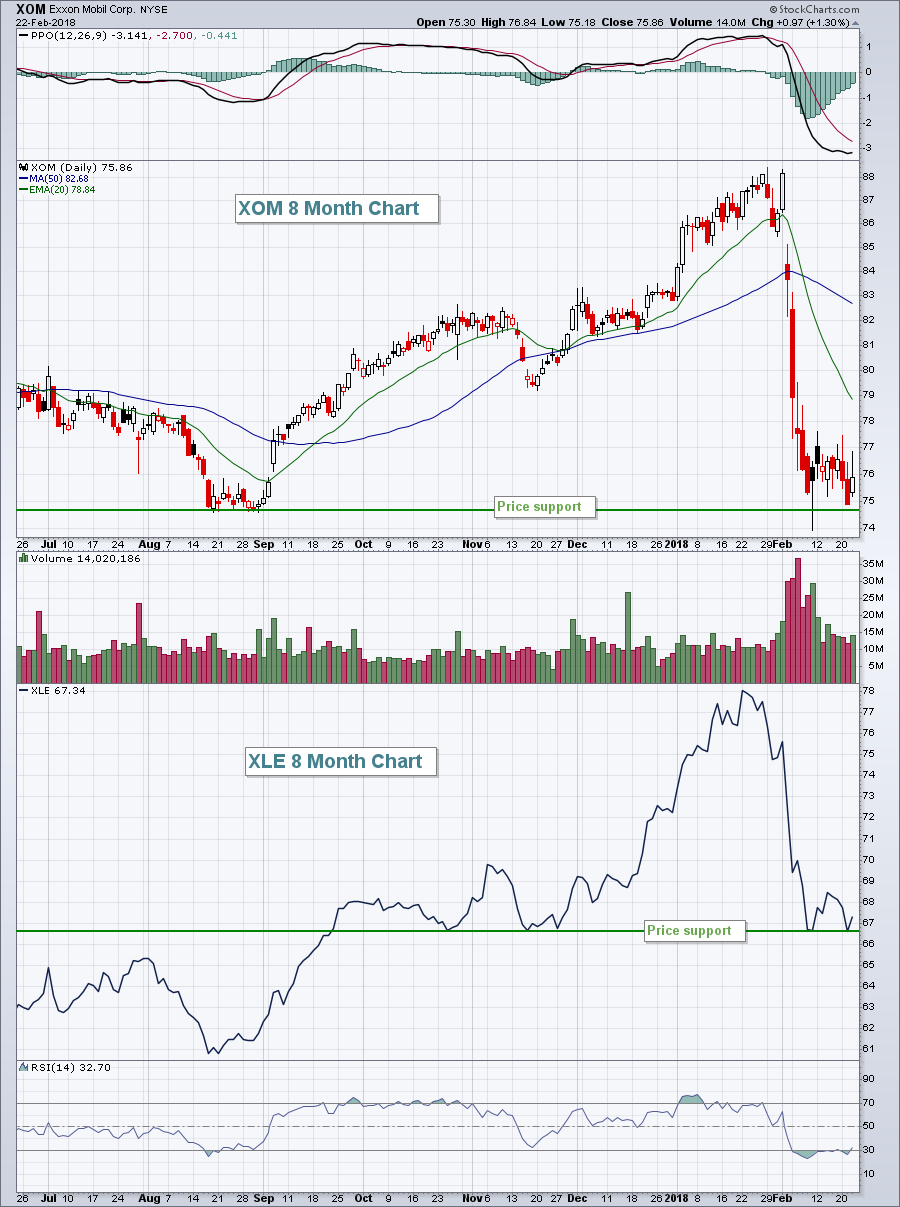
On the sector front, energy (XLE, +1.10%) regained a bit of strength as its key components - Exxon Mobil (XOM), Chevron (CVX) and Schlumberger (SLB) - all finished in positive territory. The bad news, however, is that all three finished well off their highs of the day and remain in ugly downtrends with price momentum still deteriorating. Look at the XOM chart:
 Despite the recent bounce in most U.S. equities, XOM and the energy sector have really struggled to move off its recent lows and they're both hovering just above key price support levels. Be careful with this group as traders are showing them very little love.
Financials (XLF, -0.83%) were easily the worst performing sector yesterday as banks ($DJUSBK) were notable laggards. It's not helping that the TNX is nearing yield resistance at 3.00%. Banks tend to perform best and show relative strength when the TNX is rising. But the TNX currently shows a negative divergence, providing further evidence we could see a drop in the TNX sooner rather than later. I mentioned recently that financials looked vulnerable to me and I maintain that stance. A TNX breakout above 3.00% and I'd change my tune.
For more on the banks, check out the Current Outlook section below.
Pre-Market Action
We saw strength overnight in Asia and that bullishness has carried over into Europe and here in the U.S. There's little in the way of economic news today and earnings this morning are mostly positive. Crude oil ($WTIC) has been steadily moving higher, closing at nearly $63 per barrel yesterday after recently touching $58 per barrel.
With about 45 minutes left to the opening bell, Dow Jones futures are higher by 100 points. One thing to watch is afternoon action. For the past few days, we're struggled to hold onto early gains. A strong finish would be much more bullish, as would clearing recent intraday highs.
Current Outlook
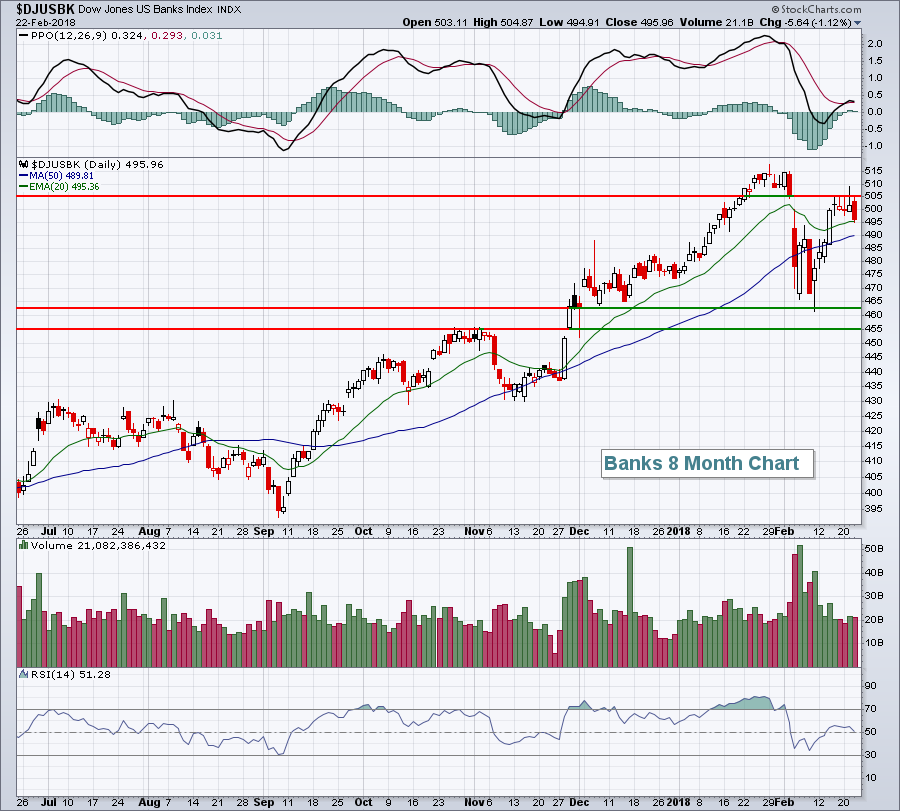
Throughout much of the late-2017 and early-2018 strength, banks ($DJUSBK) were among the leaders. The higher TNX provided a tailwind for the group, but as mentioned recently and throughout this article, I'm of the opinion we're at or near a short-term top in the TNX. If that's the case, I think it's prudent to identify support areas on the DJUSBK as potential opportunities for entry:
 Should the market roll over one more time, I could see the DJUSBK moving all the way back down to test the 455 level. That would be my worst case scenario. In the very near-term, I'd look for support at the 50 day SMA, currently at 490. One other key technical level is the 20 week EMA (not pictured above), which resides at 474.
Sector/Industry Watch
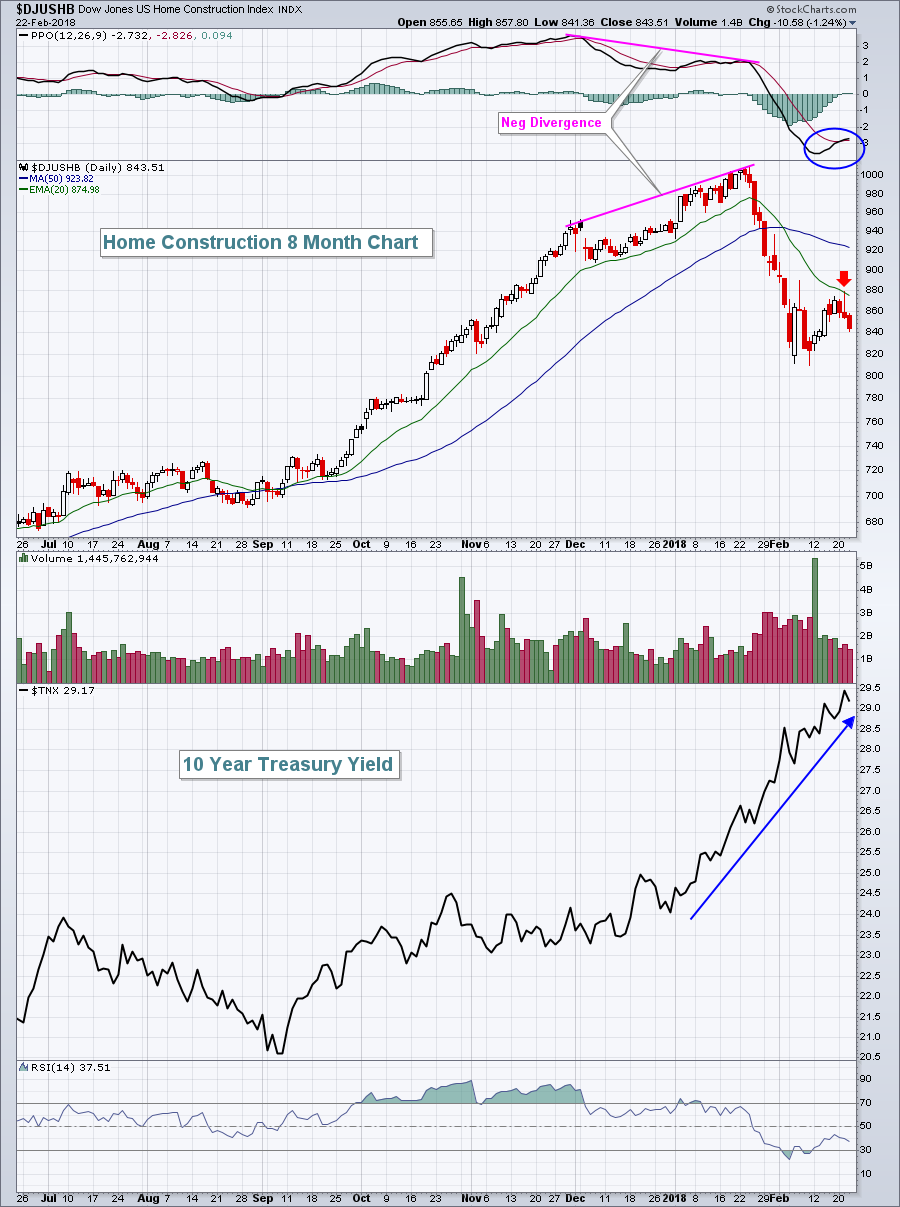
Oh how quickly the tide can change. In 2017, the Dow Jones U.S. Home Construction Index ($DJUSHB) was the 2nd best performing industry group, trailing only renewable energy ($DWCREE). But over the past month, the DJUSHB is the 3rd worst performing industry group, falling 16.2% over this span. What's happened? Well, higher interest rates are keeping investors away for sure:
 Once the TNX moved above 2.50%, it's been a very quick and steady march toward 3.00%, a major yield resistance zone on a longer-term TNX chart. So while the DJUSHB has been a primary laggard during the latest bounce (check out the failed 20 day EMA test above - red arrow), price momentum does appear to be improving (blue circle on PPO). Another fresh low in the DJUSHB would likely result in a positive divergence being established just as the TNX approaches/tests yield resistance at 3.00%. Patience could result in a very strong reward to risk entry into the group, but entry now still appears to be premature.
Historical Tendencies
It's hard to believe, but the middle of next week and we're into March! Here are the annualized returns for March and the monthly rank for the S&P 500, NASDAQ and Russell 2000:
S&P 500 (since 1950): +14.58% (ranks 4th out of 12 calendar months)
NASDAQ (since 1971): +9.36% (ranks 7th)
Russell 2000 (since 1987): +17.21% (ranks 2nd)
March historically has been an above average month, especially for the small cap Russell 2000 index.
Key Earnings Reports
(actual vs. estimate):
COG: .13 vs .12
ETR: .76 vs .44
HUN: .76 vs .66
PEG: .57 vs .56
RY: 1.72 vs 1.57
Key Economic Reports
None
Happy trading!
Tom


