Market Recap for Tuesday, February 20, 2018
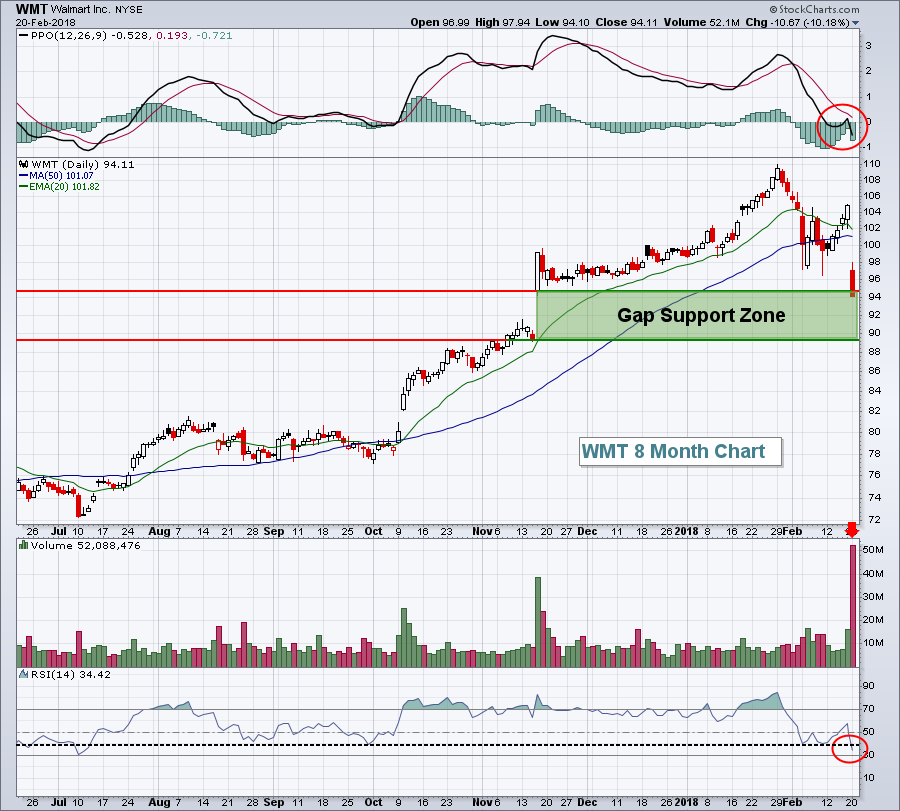
Selling returned to Wall Street as its six day winning streak came to an end. The Dow Jones was easily the biggest loser as Walmart, Inc (WMT) disappointed traders with its latest quarterly earnings report and had its worst trading day in many years, dropping more than 10%. Here's a quick look at WMT's chart:
 While Tuesday's selling was bad enough, the fact that WMT could not hold the top gap support level suggests the selling isn't over. We could see a short-term bounce at any time after such big selling, but I don't believe WMT will find an intermediate- to longer-term bottom until at least the bottom of gap support is filled at the 89 area.
While selling returned to most areas of the market on Tuesday, one notable exception was semiconductors ($DJUSSC, +1.52%). Intel (INTC) was the best performing Dow component as this chip giant advanced 1.67%, helping the Dow avert even larger losses on the session. Semiconductor strength also enabled technology (XLK, +0.09%) to finish the day atop the sector leaderboard.
Not faring so well was consumer staples (XLP, -2.27%), the worst performing sector. While WMT is included in the broadline retail ($DJUSRB) area within consumer discretionary, it's actually the 5th largest holding of the XLP. Yesterday's huge selling in WMT affected the XLP, not the XLY. Interesting indeed.
Pre-Market Action
U.S. futures are flat this morning after selling returned yesterday afternoon. Global markets were mostly mixed overnight in Asia and this morning in Europe. One exception would be Hong Kong's Hang Seng Index ($HSI), which spiked more than 550 points overnight (+1.81%).
Traders are anxiously awaiting the FOMC minutes, which will be released at 2pm EST today.
Current Outlook
Please understand that the Volatility Index ($VIX) remains elevated, closing back above 20 and rising nearly 6% during Tuesday's session. An elevated VIX equals a very risky and volatile trading environment. A reversing candle had printed on the S&P 500 Friday at a key Fibonacci retracement level (61.8%) at the same time that the VIX was approaching a critical area of past support near 17. For those of you unaware, the VIX never closed below 16 during the last two bear markets. Not once. Fear and nervousness is an essential ingredient of a bear market so if you believe this is the start of a bear market, one sign to consider that you might be wrong is the VIX moving back beneath 16-17. It touched the 17s on Thursday and Friday of last week, but bounced yesterday.
Fear could be ramping up again and the FOMC releases its latest minutes at 2pm EST today. Traders will be looking to see what the Fed discussed regarding inflation and its impact on interest rates during the balance of 2018. Is the Fed expecting inflationary pressures to increase? That very well could trigger another selling episode in the near-term so watch for it.
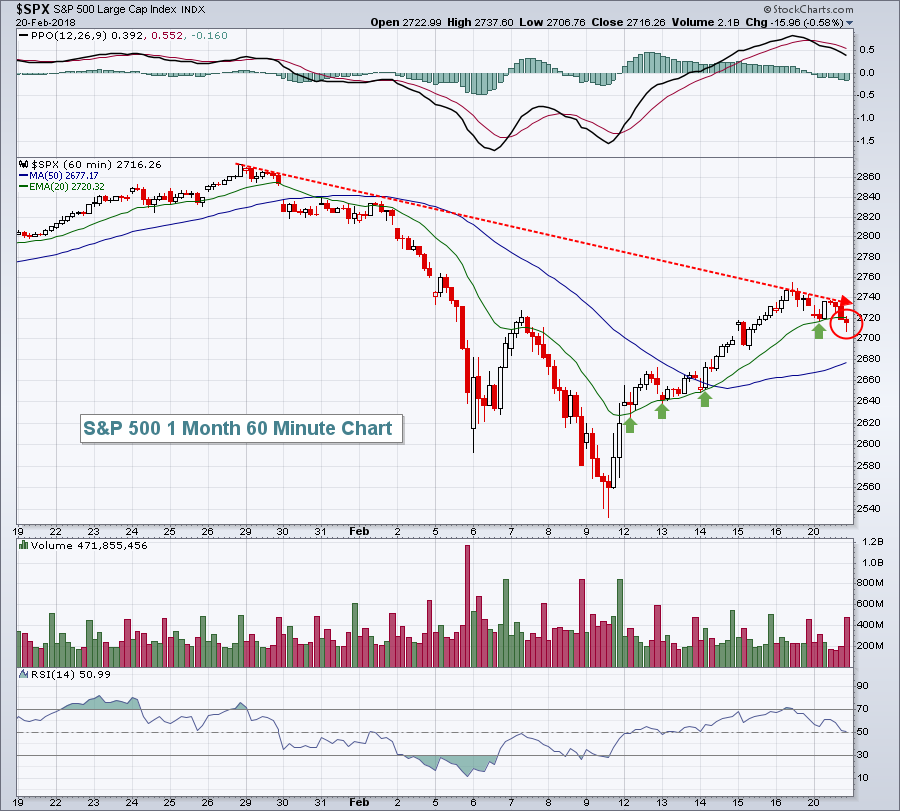
In the meantime, here's a 60 minute chart of the SPX, highlighting yesterday's finish just beneath the rising 20 hour EMA. That's another technical crack in the bulls' short-term counter trend rally foundation:
 The green arrows highlight the strength of the rising 20 hour EMA support during the six day rally, but the red circle shows that, despite a quick rally into the close on Tuesday, we did finish 4 points beneath that key moving average. The current outlook for U.S. equities is cautious, at best. Watch the VIX, S&P 500 price action relative to its 20 hour EMA, and traders' reaction to the FOMC minutes released at 2pm EST.
Sector/Industry Watch
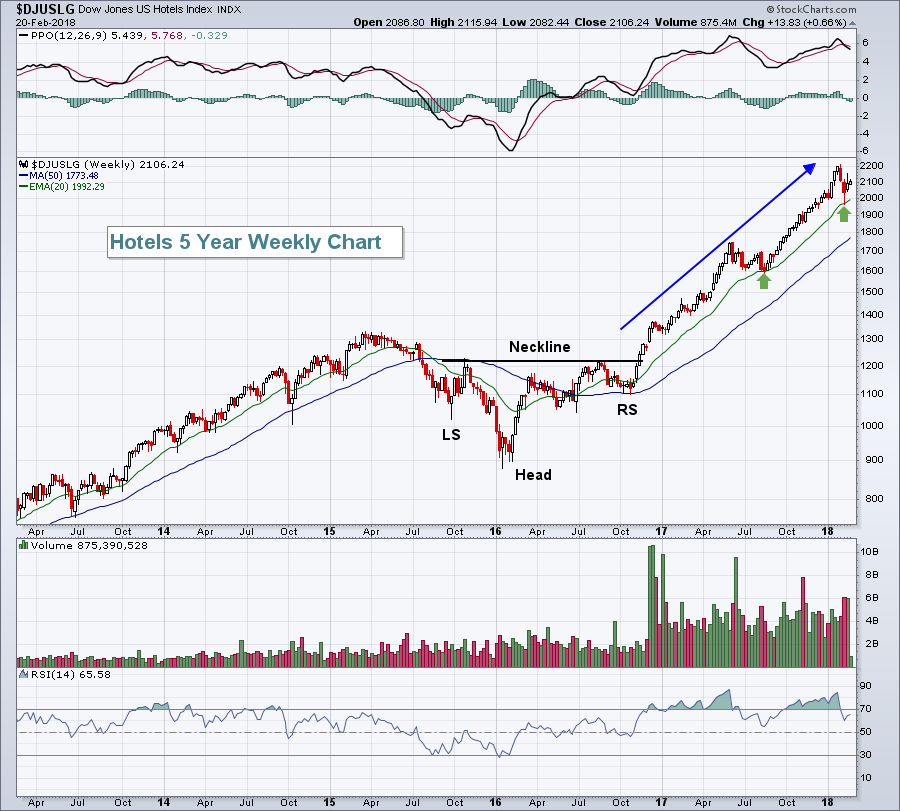
Below are some compelling seasonal tendencies for the Dow Jones U.S. Hotels Index ($DJUSLG), so with a week to go before March arrives, I thought it might be a great time to take a look at this consumer discretionary group:
 Since breaking out of a bullish inverse head & shoulders continuation pattern in late 2016, it's been straight up for this group - with barely a pause. Rising 20 week EMA tests have proven to be the best entries into this industry group. Therefore, market weakness that drives this group back to its rising 20 week EMA would provide a great opportunity from a reward to risk perspective.
Historical Tendencies
The Dow Jones U.S. Hotels Index ($DJUSLG) has outperformed the benchmark S&P 500 index by a wide margin during March and April over the past two decades. The average outperformance is 3.1% in March and 3.9% in April.
Key Earnings Reports
(actual vs. estimate):
DISH: .57 vs .56
GRMN: .79 vs .75
SO: .51 vs .46
(reports after close, estimate provided):
CLR: .32
ETE: .32
HST: .39
SNPS: 1.00
TS: .21
Key Economic Reports
February composite flash PMI to be released at 9:45am EST: 54.0 (estimate)
January existing home sales to be released at 10:00am EST: 5,650,000 (estimate)
FOMC minutes to be released at 2pm EST
Happy trading!
Tom


