Market Recap for Wednesday, February 21, 2018
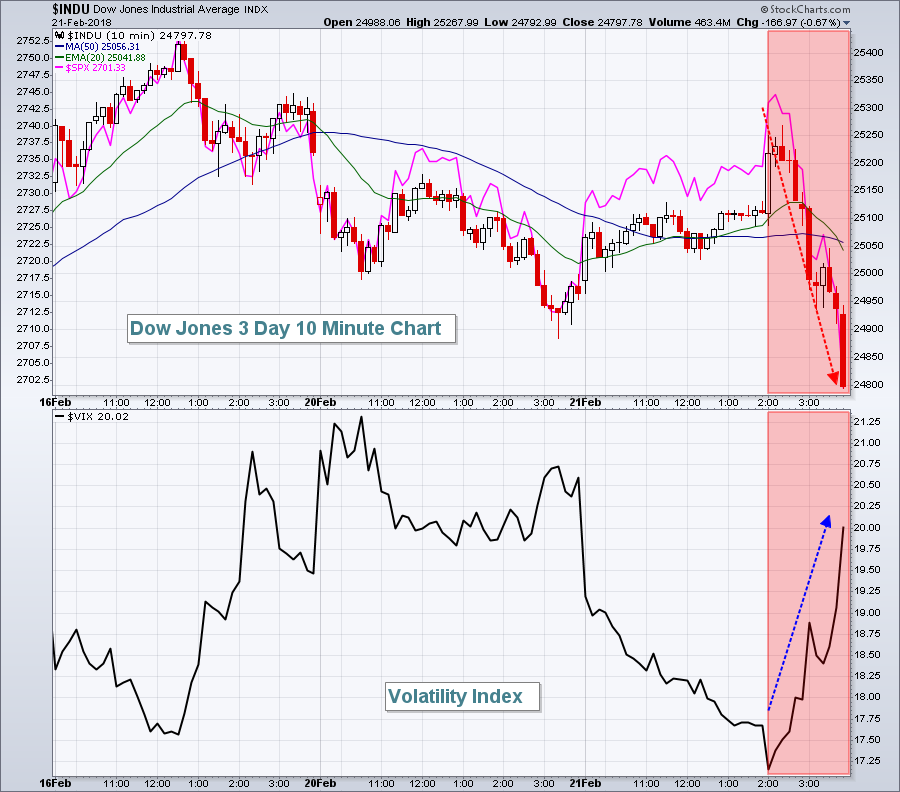
Well, the U.S. stock market was humming right along.....until the FOMC minutes were released at 2pm EST. Take a look at this intraday chart on the Dow Jones and S&P 500 and I think you'll fairly quickly realize that something happened just after 2pm:
 I don't believe interest rate fears are spooking traders. I think it's potential inflationary fears. Rising interest rates are fine for the S&P 500, so long as it's because of economic strength ahead. But if it's to combat inflation, we have a different animal. The red shaded areas above show the Dow Jones and S&P 500 dropping precipitously in the final two hours, while the Volatility Index ($VIX) surged again. But here's the good news. The VIX keeps printing lower highs and returning to key 16-17 support. A break below 16, in my opinion, really begins to favor the bulls as it would suggest the fear level is dropping far enough to keep the bears at bay. The VIX did close back above 20, however, so it makes sense to remain somewhat cautious in the very near-term to allow the market to continue to settle down.
Another piece of bullish news is that with all of yesterday's selling, the bottom three sectors were energy (XLE, -1.68%), utilities (XLU, -1.31%) and consumer staples (XLP, -1.20%). This is simply not market behavior associated with the start of a bear market. It just isn't. I can't climb on that bear market bandwagon when selling leaves financials (XLF, +0.14%) and industrials (XLI, +0.03%) unscathed. Throw in consumer discretionary's (XLY, -0.14%) meager loss and three of the four aggressive sectors once again outperformed the overall market. Bear markets trounce aggressive areas of the market.
I don't advocate rushing into equities at this exact moment because I do feel there's a decent chance we move lower one more time, especially as long as the VIX remains above 16. But I can't help but feel that when all the dust settles, we'll be looking at new all-time highs and I don't believe it'll be too far in the distance.
Just my opinion.
Pre-Market Action
U.S. futures are rebounding slightly with Dow Jones futures higher by 40 points with 30 minutes left to the opening bell. Global markets are following the lead of the S&P 500's final two hour decline from Wednesday as Asian markets were mostly lower. Tokyo's Nikkei ($NIKK) and Hong Kong's Hang Seng Index ($HSI) both fell more than 1% last night. We're seeing European markets also lower this morning with the German DAX down 0.62% at last check.
Current Outlook
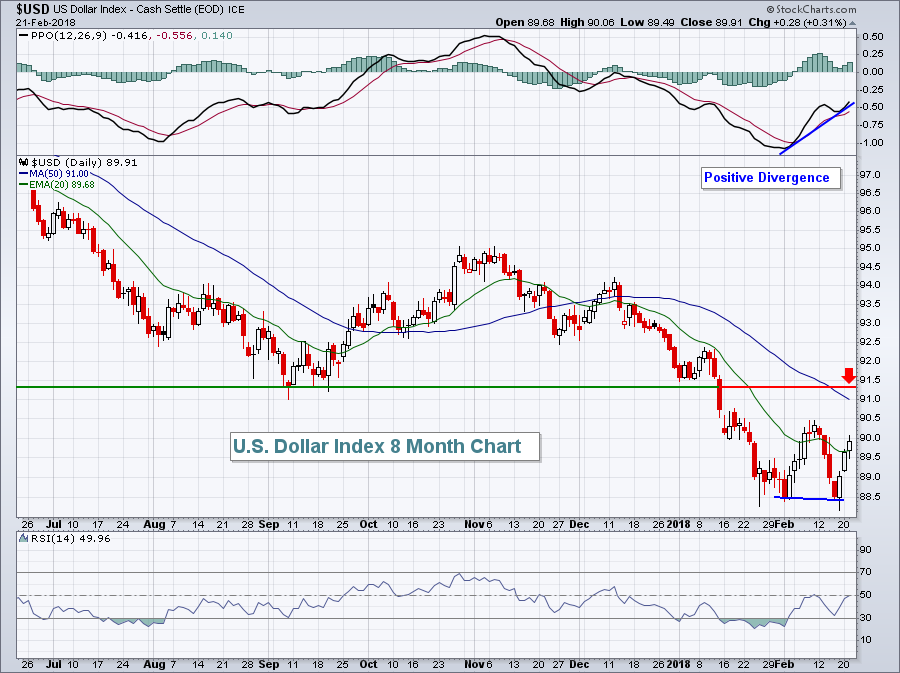
The direction of the dollar is likely to have a significant impact on the direction of equity prices and which index shows relative strength. The S&P 500 has enjoyed 15 months of dollar decline (falling dollar aids S&P 500 profits). A rising dollar won't necessarily stop earnings growth on the S&P 500, but it will provide a headwind. Currently, there are positive divergences on the U.S. Dollar Index ($USD) daily and weekly charts. Here's the daily chart:
 In the very near-term, I'd expect to see the USD approach and test the 91.00-91.50 area. The 50 day SMA resides at 91.00 and price resistance is just above that level. A break above 91.50 would be much more meaningful technically. Significant rises in the USD tend to favor small cap stocks on the Russell 2000 as these stocks do the majority, if not all, of their business domestically. Hence, they feel no negative impacts from the dollar as far as translating currency gains and losses.
Sector/Industry Watch
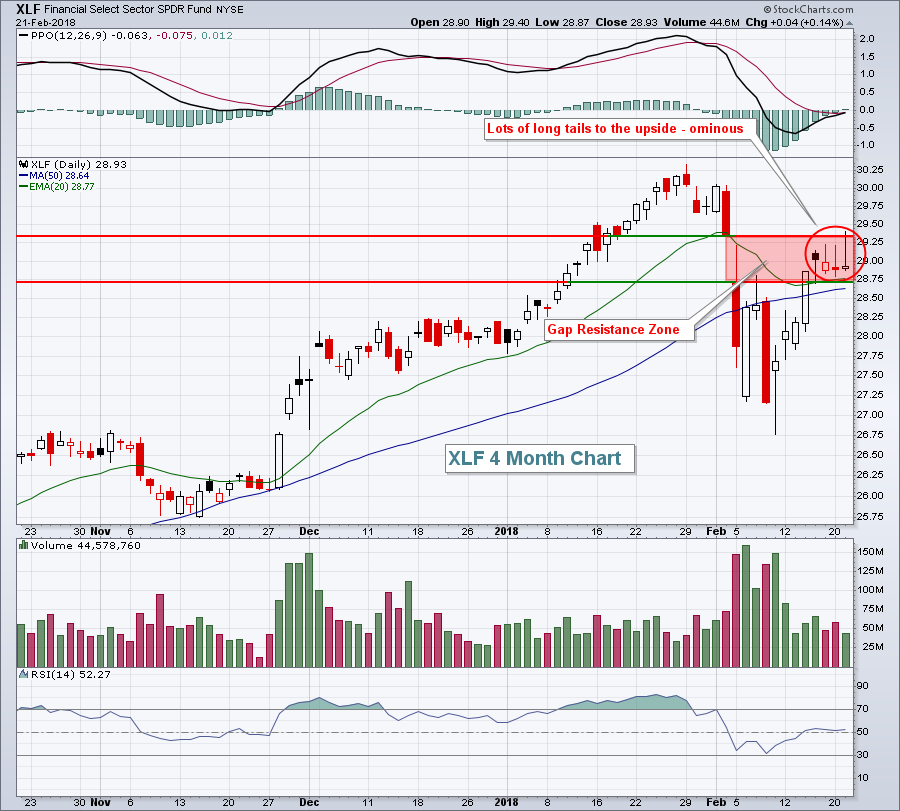
The financial sector (XLF) managed to hold up better than most areas on Wednesday as the 10 year treasury yield ($TNX) jumped another 5 basis points to finish at 2.94%. It's probably a good time to consider exiting many areas of financials as a major overhead obstacle at 3.00% lies ahead for the TNX and if the TNX tops, there'll be added selling pressure in the XLF. The XLF chart also looks quite toppy in the near-term:
 Watch the 20 and 50 day moving averages to the downside. A close beneath both would likely confirm that the recent tails to the upside have marked a short- to intermediate-term top.
Historical Tendencies
Tomorrow will mark the end of the current historical bearish period for the Russell 2000 (small caps). The S&P 500 and NASDAQ end their respective historical bearish periods on February 22nd (today). The balance of February tends to be fairly neutral. The next bullish historical period begins March 1st on the S&P 500. More on that later.
Key Earnings Reports
(actual vs. estimate):
CM: vs 2.26 (awaiting results)
HCN: 1.02 vs 1.04
HRL: .44 vs .44
MGA: 1.57 vs 1.58
NEM: .40 vs .40
PPL: .55 vs .48
(reports after close, estimate provided):
HPE: .23
HPQ: .42
INTU: .34
MELI: .55
Key Economic Reports
Initial jobless claims released at 8:30am EST: 222,000 (actual) vs. 230,000 (estimate)
January leading indicators to be released at 10:00am EST: +0.6% (estimate)
Happy trading!
Tom


