Market Recap for Monday, March 26, 2018
It was an impressive rally on Wall Street on Monday. All nine sectors advanced at least 1%. The four aggressive sectors - technology (XLK, +3.80%), financials (XLF, +3.24%), consumer discretionary (XLY, +2.95%) and industrials (XLI, +2.42%) - were the clear leaders on the rally and this underscores the continuing strength of this bull market. Yes, we've seen scary periods of selling, but market participants are not running for safety during rallies. They continue to chase after the highest risk areas of the market. This is a display of "risk on" behavior that fuels bull markets.
The Volatility Index ($VIX, -15.44%) dropped as we'd expect to see on a rally like Monday's. It turned back down, leaving Friday's candle on an "island". That is a topping signal, but the VIX still remains at 21.03, an unusually high level. That means we could continue to see wild swings in both directions. Panic would likely set in if the VIX were to clear the recent double top near 27:
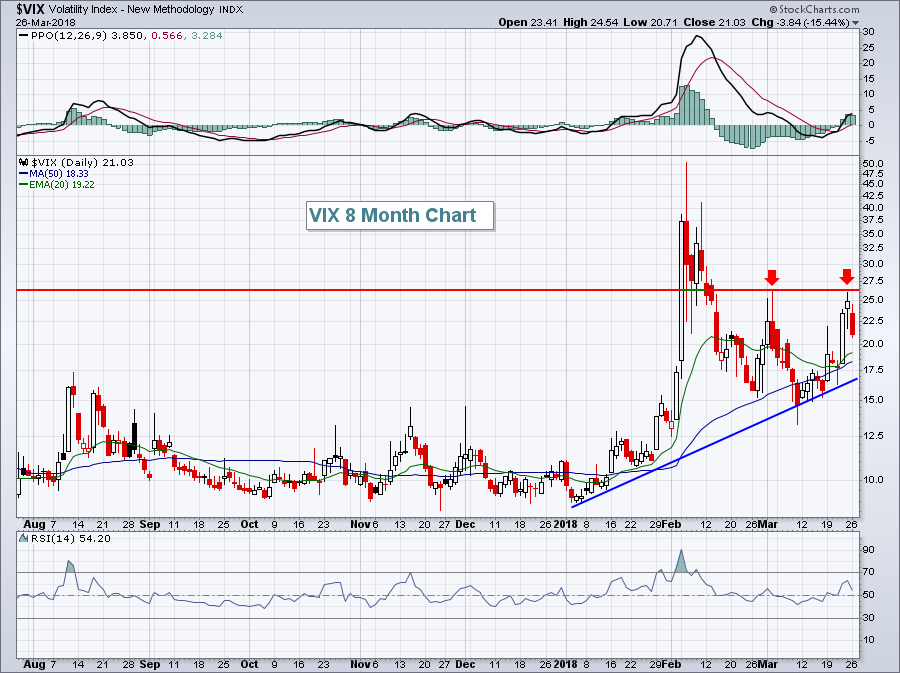 As the market swings, we should watch closely the current VIX trading range from roughly 17.00-27.00. That's trendline support to the downside and the double top resistance to the upside. I'm bullish and am looking for a breakdown in the VIX to confirm our next bull market leg higher. April tends to be very bullish for equities and I expect it to be in 2018 as well. But we may have to deal with further consolidation and volatility first.
Facebook (FB) is a very unhealthy stock that is underperforming its internet peers, and has been for many months. However, Monday's reversing hammer candlestick printed on extremely heavy volume. That suggests to me that a short-term bottom is in and we could see a rally to test either 170 price resistance, the 20 day EMA currently at 174.37, or both. Here's the latest look at FB:
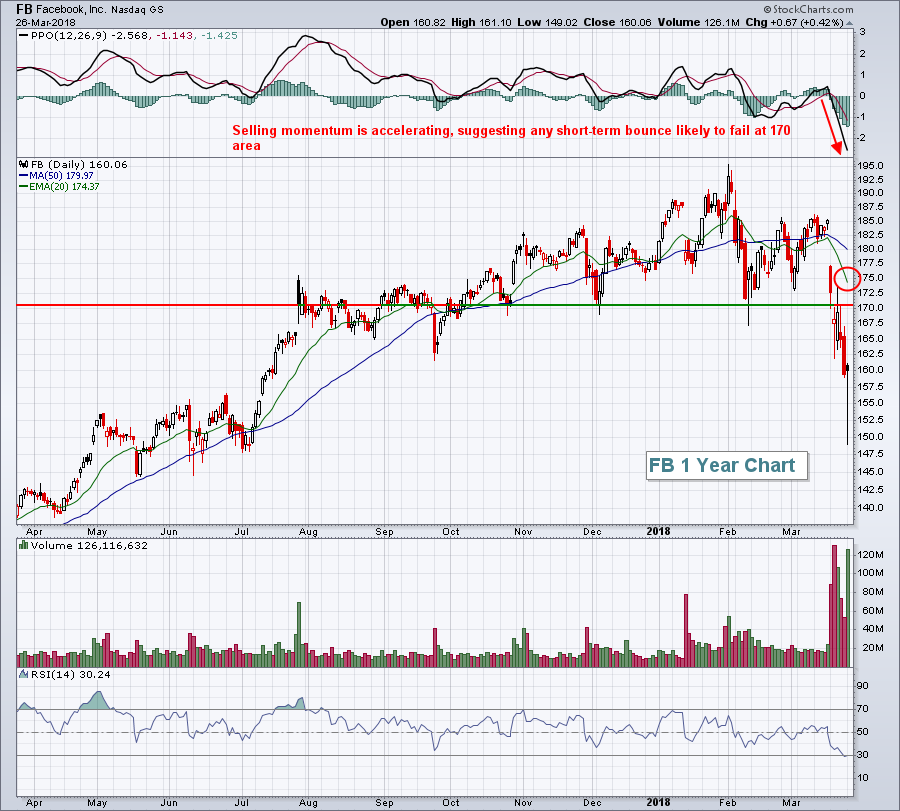 I cannot overstate the significance of the volume that's accompanied FB's decline. Obviously, I could be wrong, but a serious message is being sent here. I don't like FB as a longer-term hold at this point. In fact, I'd be a seller into strength in the upcoming days/weeks.
Pre-Market Action
U.S. stocks are poised to rally, continuing Monday's surge. Dow Jones futures are higher by 116 points with about 45 minutes left to the opening bell.
Global markets rallied overnight in Asia and this morning in Europe. The German DAX ($DAX) is up more than 200 points and challenging the 12000 level, one day after closing at 1 year lows on two consecutive trading sessions.
Red Hat (RHT) reported its latest quarterly results after the closing bell yesterday and is trading up more than 6% in pre-market to an all-time high. RHT is part of the very strong software space ($DJUSSW).
Current Outlook
The recent volatility and short-term price breakdowns witnessed here in the U.S. is being seen throughout many parts of the globe. But I see bullish patterns or key price support being tested around the world. For instance, let's look at the India Bombay Stock Exchange 30 Sensex Index ($BSE). Prices have remained beneath the falling 20 day EMA for the past two months, but I believe that will change sooner rather than later based on this bullish wedge pattern that's emerged:
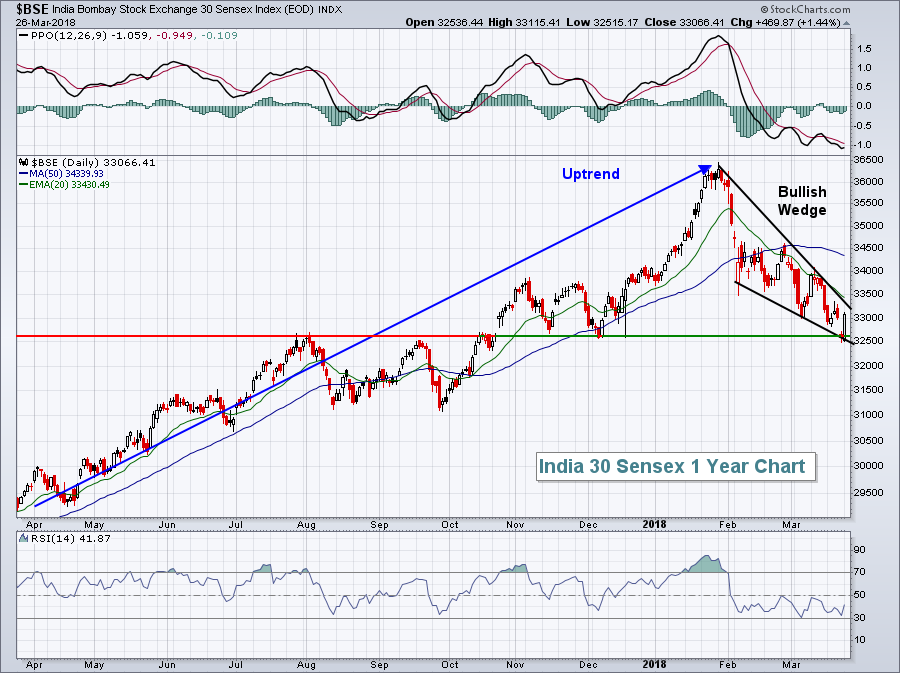 The bottom of this pattern is also coinciding with a major price support. I'd look for upcoming strength and a breakout above 33500 to confirm this bullish pattern and to extend the long-term rally.
Sector/Industry Watch
The Dow Jones U.S. Biotechnology Index ($DJUSBT) hit a major price support level and bounced yesterday. The 1925 area marks the November low and the following weekly chart shows intraweek low between 1900 and 1925 as excellent price support:
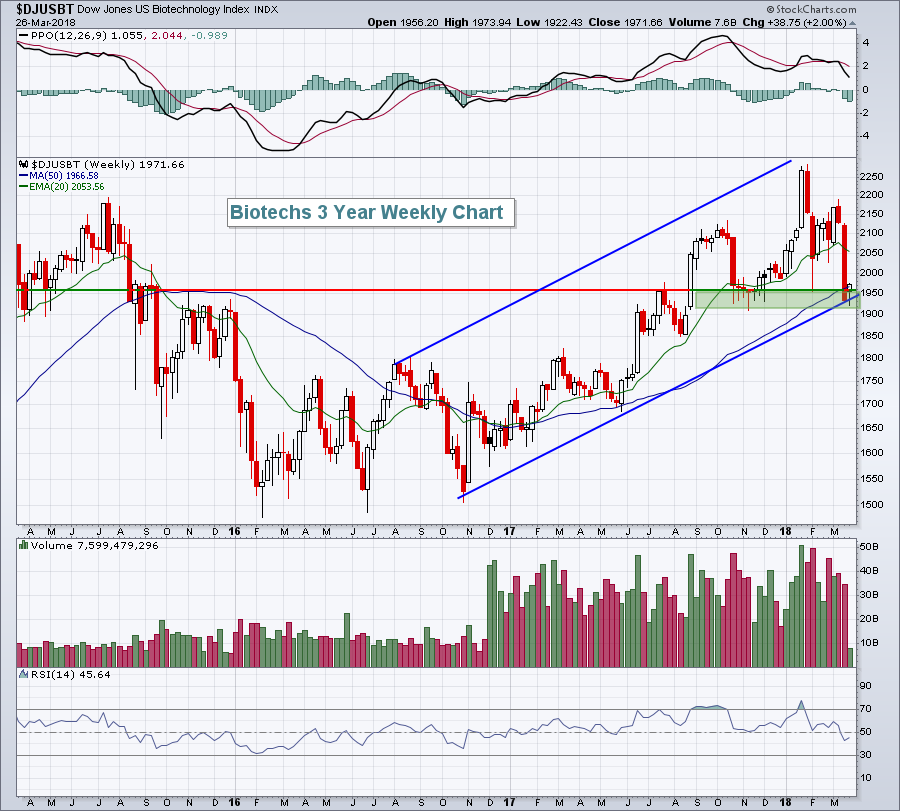 I look for the DJUSBT to lead on a relative basis from the current price support zone. On a much longer-term chart, the earlier breakout above 2200 measured to 2900. With the index now at 1972, there could be a ton of upside in this area if the bull market does resume.
Historical Tendencies
Automobiles ($DJUSAU) printed a reversing candle on Monday and it's approaching its best calendar month (April) by far. Over the past two decades, the DJUSAU has moved higher during April 15 of the last 19 years with an average April gain of 9.3%.
April through June represent the three best months of the year - at least seasonally - for Tesla (TSLA). Ford (F) has averaged gaining 12.4% during April over the past 20 years, while the other 11 months of the year have averaged losing 5.3%. That's crazy!
While history provides us no guarantees of future results, I do find stats like this to be very interesting to say the least.
Key Earnings Reports
(actual vs. estimate):
FDS: 2.12 vs 2.05
INFO: .53 vs .49
MKC: 1.00 vs .91
(reports after close, estimate provided):
LULU: 1.27
Key Economic Reports
January Case-Shiller HPI to be released at 9:00am EST: +0.7% (estimate)
March consumer confidence to be released at 10:00am EST: 131.0 (estimate)
Happy trading!
Tom


