Market Recap for Friday, March 23, 2018
All of our major indices tumbled on Friday, but none are struggling quite the same as the Dow Jones, which fell another 425 points on Friday to close at its lowest level since November 2017. There are likely three reasons for this relative underperformance. The first likely stems from a potential trade war. The Dow Jones is made up of 30 of the world's largest companies and these companies do business throughout the world. A trade war that pits China against the U.S. or one that develops into the U.S. against the world would likely have its biggest impact among those companies doing business everywhere. How this all unfolds is quite uncertain and Wall Street loathes uncertainty. The second negative for the Dow Jones is that the U.S. Dollar ($USD) remains above its late January low. If the USD is strengthening, it will hurt companies doing business outside the U.S. as there'll be foreign currency translation losses to factor in. Finally, and this is a recent development, financials (XLF, -3.04%) and industrials (XLI, -1.46%) have led this latest wave of selling and there are 10 such companies in the Dow Jones. Of these 10, only the two consumer finance companies - Visa (V) and American Express (AXP) - are showing any kind of relative strength. The others have either broken beneath their February lows or on the verge of doing so.
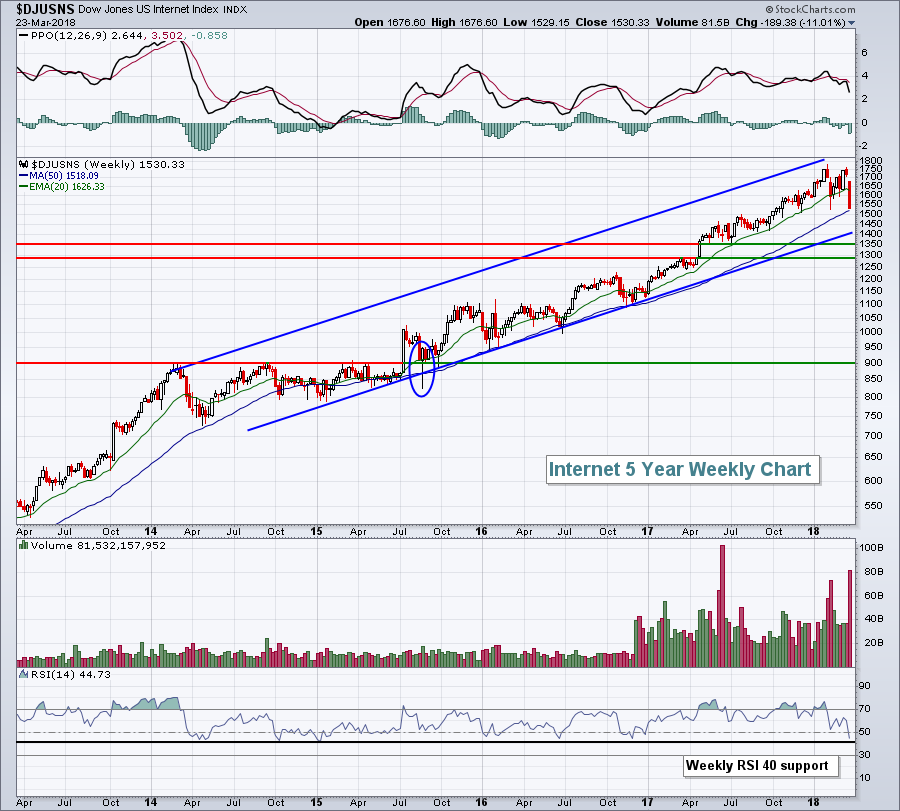
Another development worth watching is the sudden selling in technology stocks (XLK, -2.67%). The XLK has now fallen 7.66% over the past week, the most among all sectors. We've been used to strong relative performance within technology, but that wasn't the case last week as internet stocks ($DJUSNS) tumbled 11.01%, thanks in large part to Facebook's (FB) 13.89% plunge. While FB grabbed many of the headlines last week, Twitter (TWTR), Baidu (BIDU) and Alphabet (GOOGL) fell in sympathy, dropping 12.79%, 12.31% and 10.05%, respectively. It was perhaps an even uglier week for the DJUSNS than that blood bath in early February:
 An elevated VIX can trigger panicked selling, but that can also set up excellent trading opportunities. I haven't given up on the DJUSNS, despite the massive selling that took place last week. In fact, I'd love to see a similar selloff to mid-2015, when the DJUSNS fell below its long-term uptrend line intraweek, but then recovered quickly. That drop of roughly 17%, if equalled in 2018, would send the DJUSNS down to perhaps the 1425 area. That would represent a test of the long-term uptrend line and an excellent high reward to risk entry into one of the most exciting areas of the stock market.
Pre-Market Action
In pre-market action, U.S. indices look to recover much of Friday's losses with Dow Jones futures higher by 330 points with just under an hour before the opening bell. The 10 year treasury yield ($TNX) has climbed back to 2.85% as markets stabilize following China's willingness to hold talks regarding trade differences. That news has helped to calm fears of a global trade war.
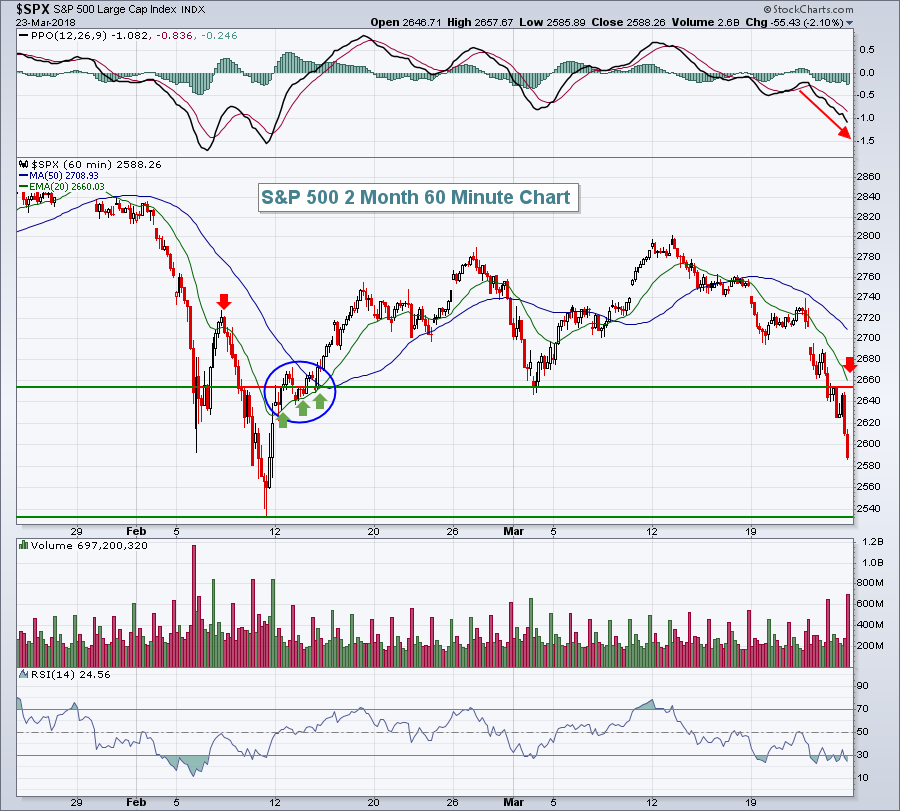
Technically, the declining 20 hour EMA will serve as a first major test for a recovery. Here's an intraday hourly look at the benchmark S&P 500:
 The early-February selling can serve as a guide. The first bout of panicked selling in February led to a recovery, but the S&P 500 struggled when it hit that 20 hour EMA (red arrow). We couldn't sustain the move above that moving average and back down we went. The second time through the 20 hour EMA was a different story, however. The green arrows show that the 20 day EMA was able to hold and that helped us sustain a recovery. Future are very strong this morning, but the big test, in my opinion, will be whether we can pierce that 20 hour EMA.....and hold on.
We're set to kick off another interesting and very volatile week.
Current Outlook
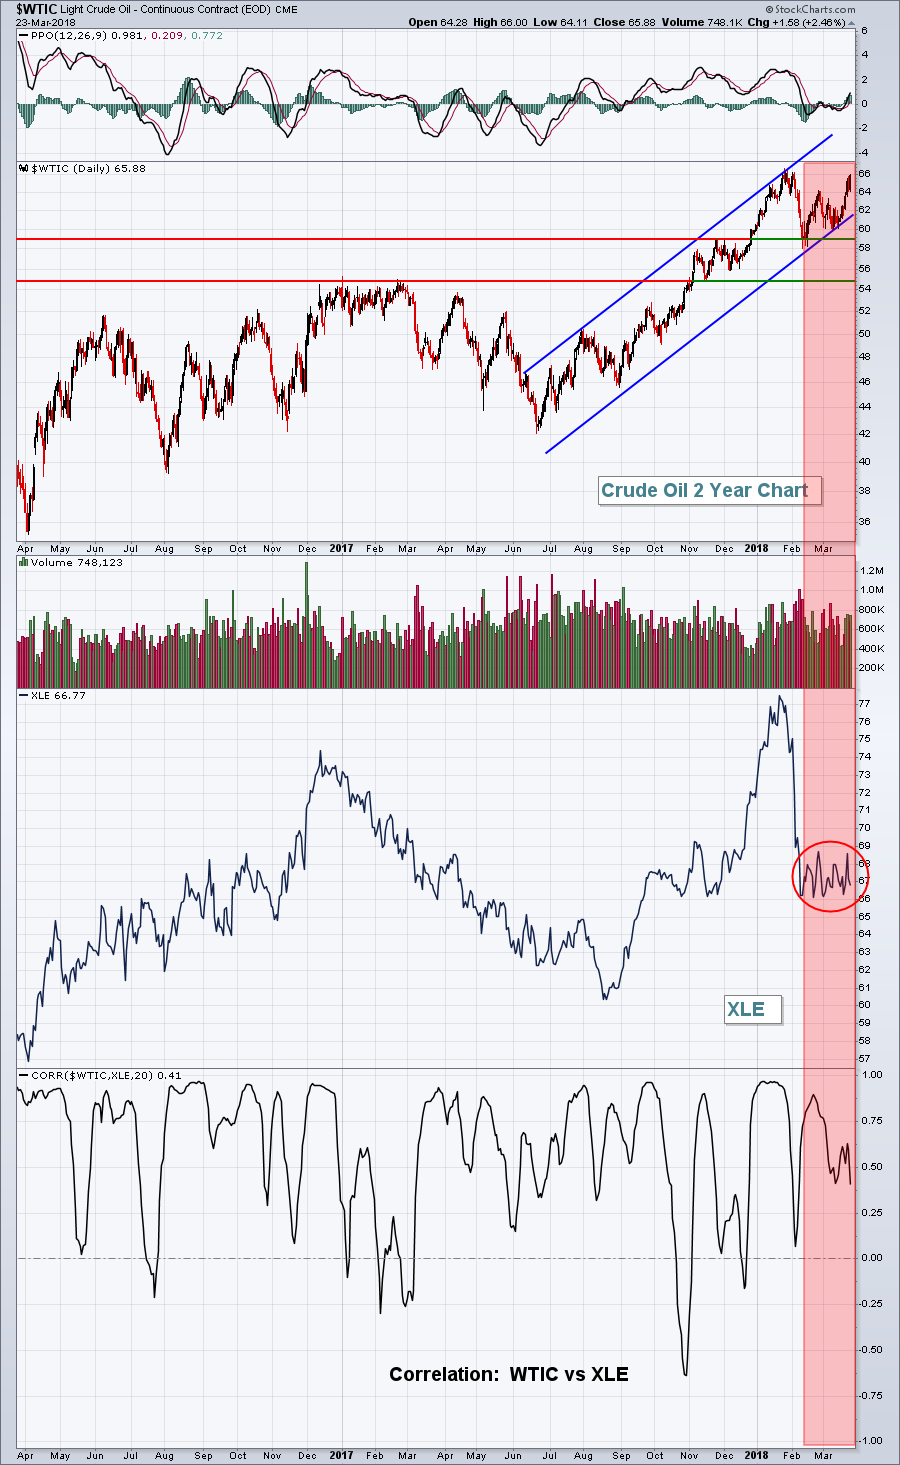
There's been a serious disconnect between the price of crude oil and the direction of the XLE since the early February decline in both. The chart below highlights this somewhat rare divergence (red shaded area):
 First, recognize that crude oil prices ($WTIC) have remained in a solid uptrend since the summer of 2017 and that paints a bullish global economic picture. But over the past 6-7 weeks, we've crude oil prices rebound while the XLE has meandered in a 66-69 trading range. The correlation indicator above tells us that the XLE and WTIC tend to move together. So one of two things is likely to happen this spring. Either we'll see the XLE make a major move higher, possibly leading all sectors on a relative basis to play "catch up".....or a slowing of global economic growth will surface and drive crude oil prices lower.
Sector/Industry Watch
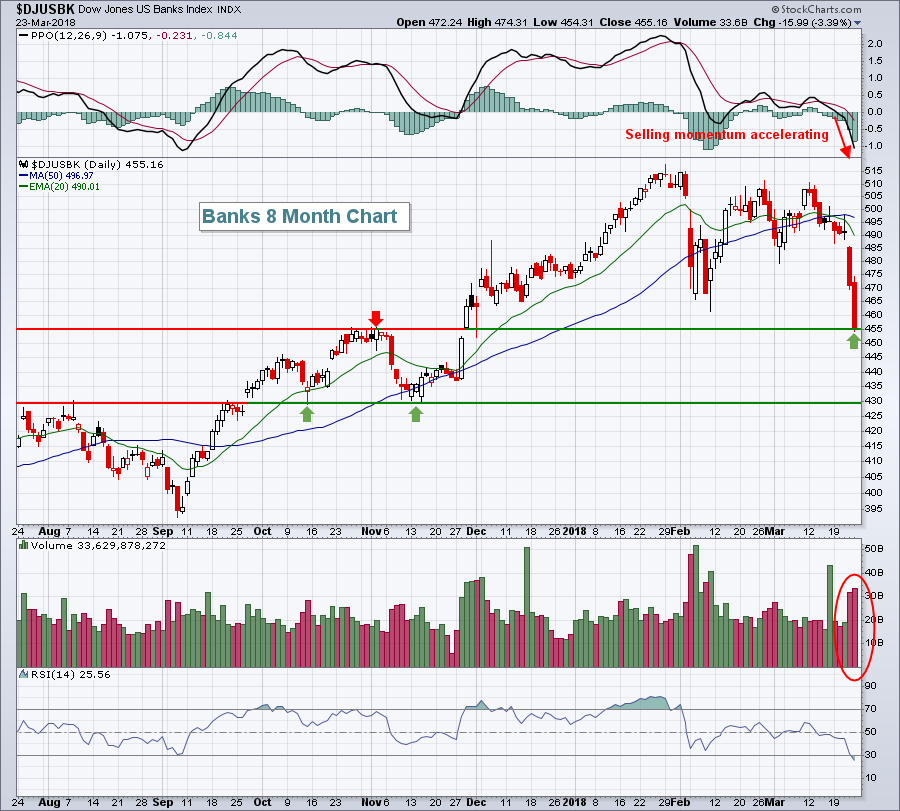
The Dow Jones U.S. Banks Index ($DJUSBK) fell 3.39% on Friday and that came on the heels of a 4.05% drop on Thursday. That's close to a 7.50% drop in two days, which is not your ordinary pullback. While I'm not ready to throw in the bullish towel based on two days of trading, it's certainly worth noting and watching to see how the group responds this week. Here's the ugly chart:
 Volume accelerated on the selling as it appeared significant distribution was taking place. I've highlighted the two biggest levels of price support on the chart and we tested the first one with the Friday selling. Should selling once again kick in this week, look to 430 as major support. A reversal at that level could provide an excellent entry into this group. The direction of the 10 year treasury yield ($TNX) also plays a big role in bank performance. I'd be okay with the TNX falling to the 2.75% area, but much below that could signal more trouble ahead for banks.
Monday Setups
Given the huge spike and breakout in the Volatility Index ($VIX) last week, I will refrain from providing trade setups today. Should we see a big reversal today or later this week, I may revisit this section. An unusually high and rising VIX corresponds with an extremely risky market to trade, either on the long or short side. One of my goals is to manage risk. I sit out periods like this and allow the market to settle down.
Historical Tendencies
April is one week away and has historically been a solid month for U.S. equities. Here are the following annualized returns by key index:
S&P 500 (since 1950): +17.06% (ranks 3rd among all calendar months)
NASDAQ (since 1971): +17.39% (ranks 4th of 12)
Russell 2000 (since 1987): +14.04% (ranks 6th of 12)
Normally, the last week of the calendar month is bullish as well. However, March is an exception. Over the past 47 years on the NASDAQ, for instance, the upcoming week (March 26th through 30th) has produced annualized returns of -18.68%.
Key Earnings Reports
(actual vs. estimate):
PAYX: .63 vs .62
(reports after close, estimate provided):
RHT: .80
Key Economic Reports
None
Happy trading!
Tom


