Market Recap for Friday, April 6, 2018
All nine sectors fell on Friday as the Dow Jones tumbled 572 points amid more threats of China tariffs by the White House. China has promised further retaliation if the U.S. remains adamant about imposing tariffs on China imports. This rhetoric back and forth has escalated the "volatility war" that began in early February.
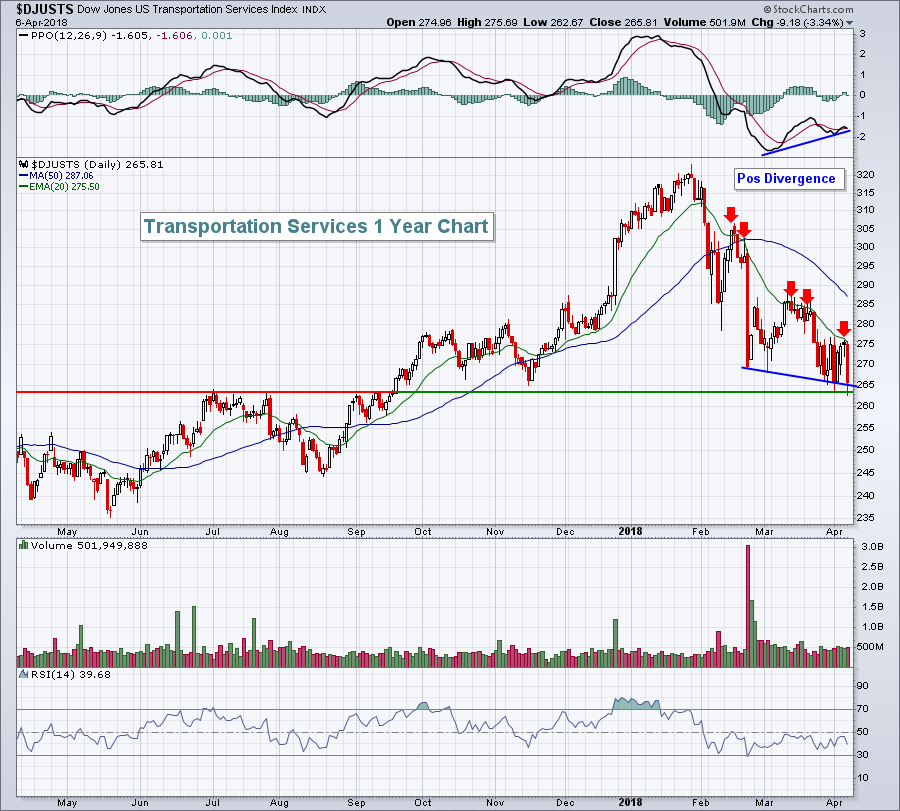
As you might expect, the defensive utilities (XLU, -0.79%) and consumer staples (XLP, -1.02%) sectors were the least impacted by Friday's selloff, while industrials (XLI, -2.77%) and technology (XLK, -2.45%) absorbed the bears' biggest punches. Transportation services ($DJUSTS) fell 3.34% and are perhaps the most poised of the industrial areas for a short-term rebound. Selling momentum appears to be slowing just as the group tests key price support:
 The declining 20 day EMA (red arrows) has been mostly impenetrable since this decline began, but the now-rising PPO suggests the short-term selling could be nearing an end - and just as it tests key price support just below 265. Two of the best performing stocks in this industry include XPO Logistics (XPO) and Echo Global Logistics (ECHO). A stock in this industry group with a chart similar to the DJUSTS is Air Lease (AL) with a solid positive divergence of its own. AL should hold onto price support in the 40.00-40.50 area. A loss of price support, especially on higher than normal volume, would be an indication that it's likely poised for another leg lower.
Pre-Market Action
U.S. futures are solid thus far to open a new trading week. Asian and European markets have mostly shrugged off the big selling that gripped Wall Street on Friday as we're seeing mostly higher global markets. Overnight, the Hang Seng Index ($HSI) climbed 384 points, or 1.29%. That could help to relieve anxieties here in the U.S. today.
Dow Jones futures are currently higher by 139 points with a little less than an hour to the opening bell.
Current Outlook
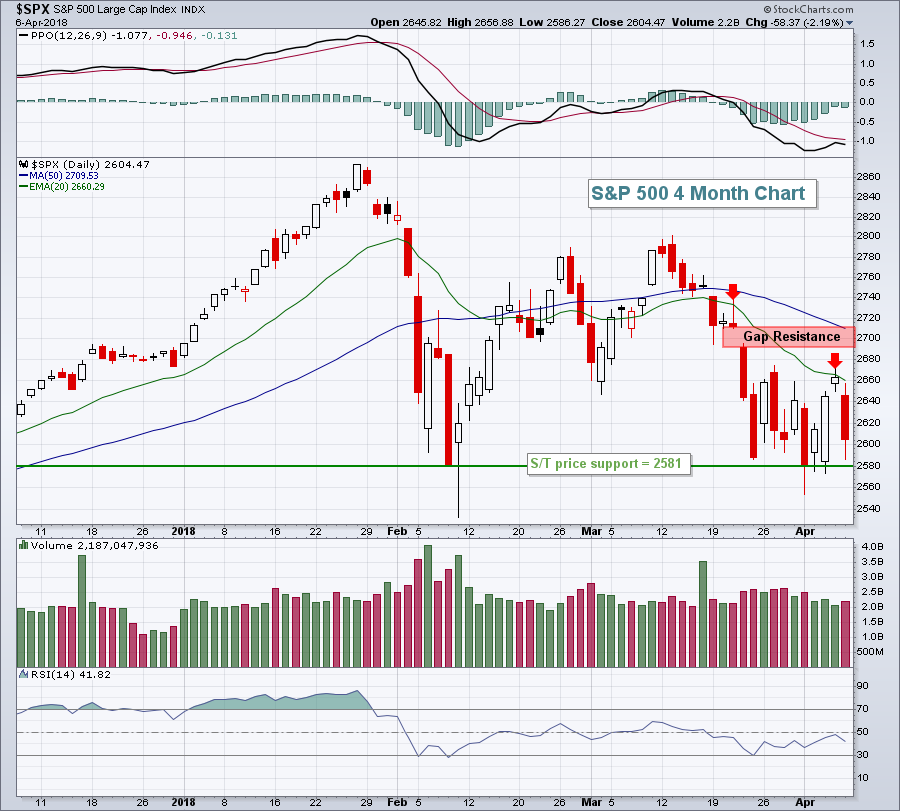
For the 10th time in the past couple months, the S&P 500 traded beneath 2600 on Friday, dropping 58 points, or 2.19%, on the session. But on all 10 occasions, we've seen the S&P 500 close at 2581 or above. That's the line in the sand that the bulls have drawn to date so we should recognize that as the most significant price support level on the short-term chart:
 To the top side, the declining 20 day EMA has already proven to be formidable short-term resistance (red arrows). Should we break above the 20 day EMA, then gap resistance near 2700 becomes the next target.
Sector/Industry Watch
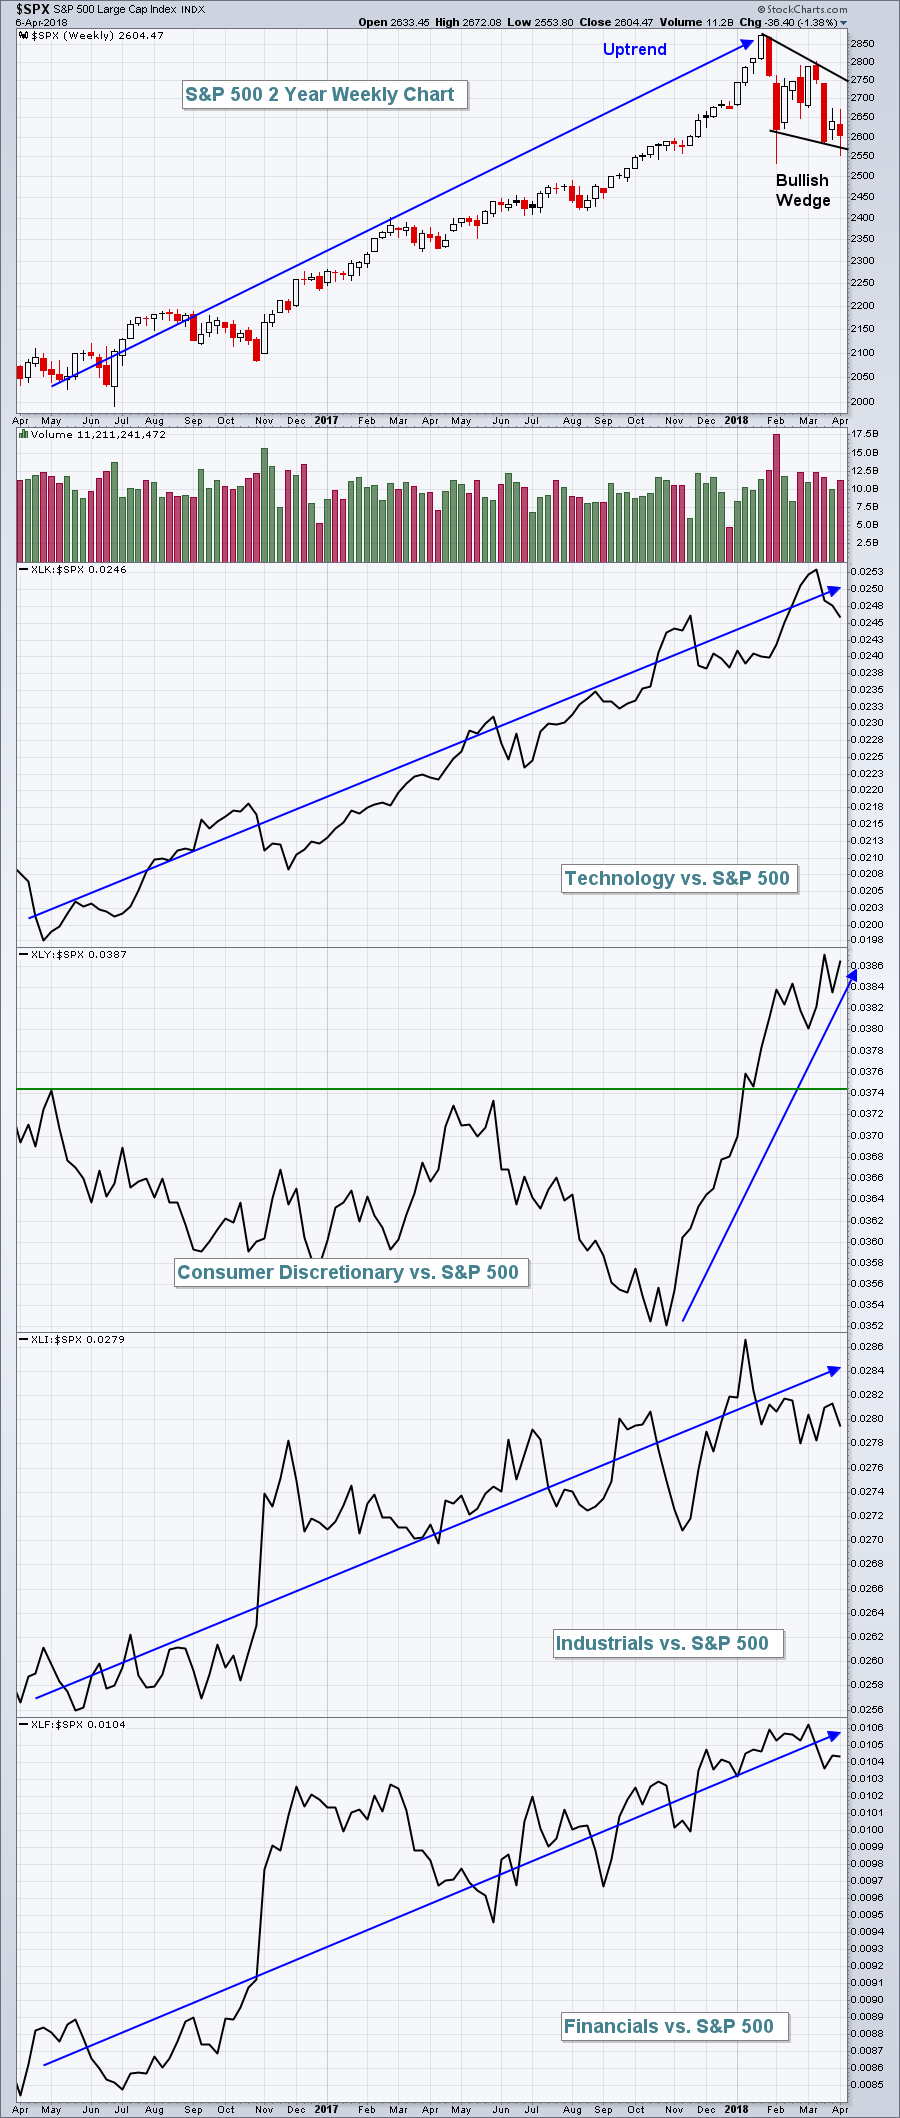
When our major indices consolidate, it's quite typical for aggressive sectors to underperform on a relative basis. Recently, the defensive XLU and XLP have both outperformed the benchmark S&P 500 index. I'm not concerned about that. What would be alarming would be the S&P 500 moving to fresh new highs with continuing leadership from both of those two defensive groups. Should that happen, I'd most certainly move to a more defensive, maybe even bearish, position. The long-term relative performance of aggressive sectors, though, remains quite bullish:
 Watch these ratios as the S&P 500 rebounds. Should they begin to turn lower and clear prior lows as the benchmark index sets new highs, then "Houston, we've got a problem." Until then, I'm staying bullish.
Monday Setups
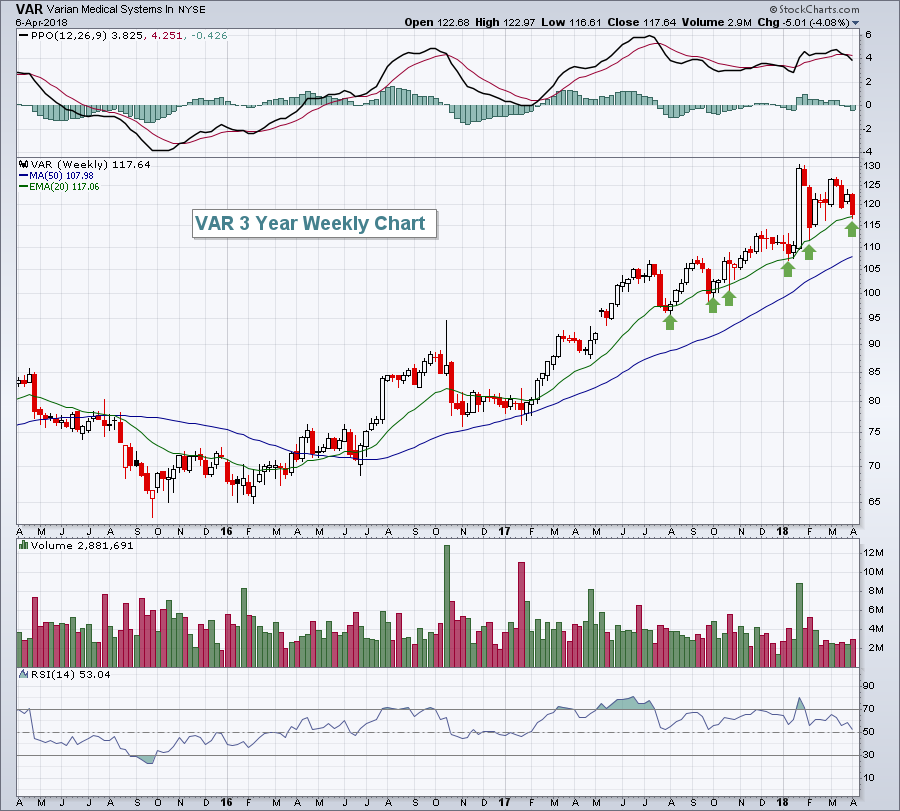
For this week's setup, I'm going with a familiar name - Varian Medical Systems (VAR). It bounced off its earnings-related gap support near 113 in early February, rebounding to 127 five weeks later. But the market's volatility is creating another opportunity in VAR as it's back to 117.64 at Friday's close. While we could see another test of gap support near 113, I believe the reward to risk has grown to the point where VAR is worth accumulating from the current price down to gap support - should it get there. The weekly chart shows a solid 20 week EMA test currently at hand, another reason for a near-term bounce:
 Consider accumulating in the 113-118 area with a closing stop beneath 112. A target price of 130 to test the January price high is what I'd be looking for.
Historical Tendencies
The 9th day of the calendar month typically is a bearish one. For instance, since 1971 on the NASDAQ, the 9th calendar day has produced annualized returns of -21.33%. Only the 19th and 20th have produced worse results with annualized returns of -28.48% and -30.68%, respectively.
This doesn't mean that the NASDAQ falls the 9th calendar day of every month, so please don't take this literally. In fact, the NASDAQ has risen 212 times on the 9th calendar day, while dropping only 183 times. So the odds of an advance are greater than 50/50. However, when the NASDAQ drops on the 9th calendar day, it's had the propensity to be a severe drop.
Key Earnings Reports
None
Key Economic Reports
None
Happy trading!
Tom


