Market Recap for Friday, May 25, 2018
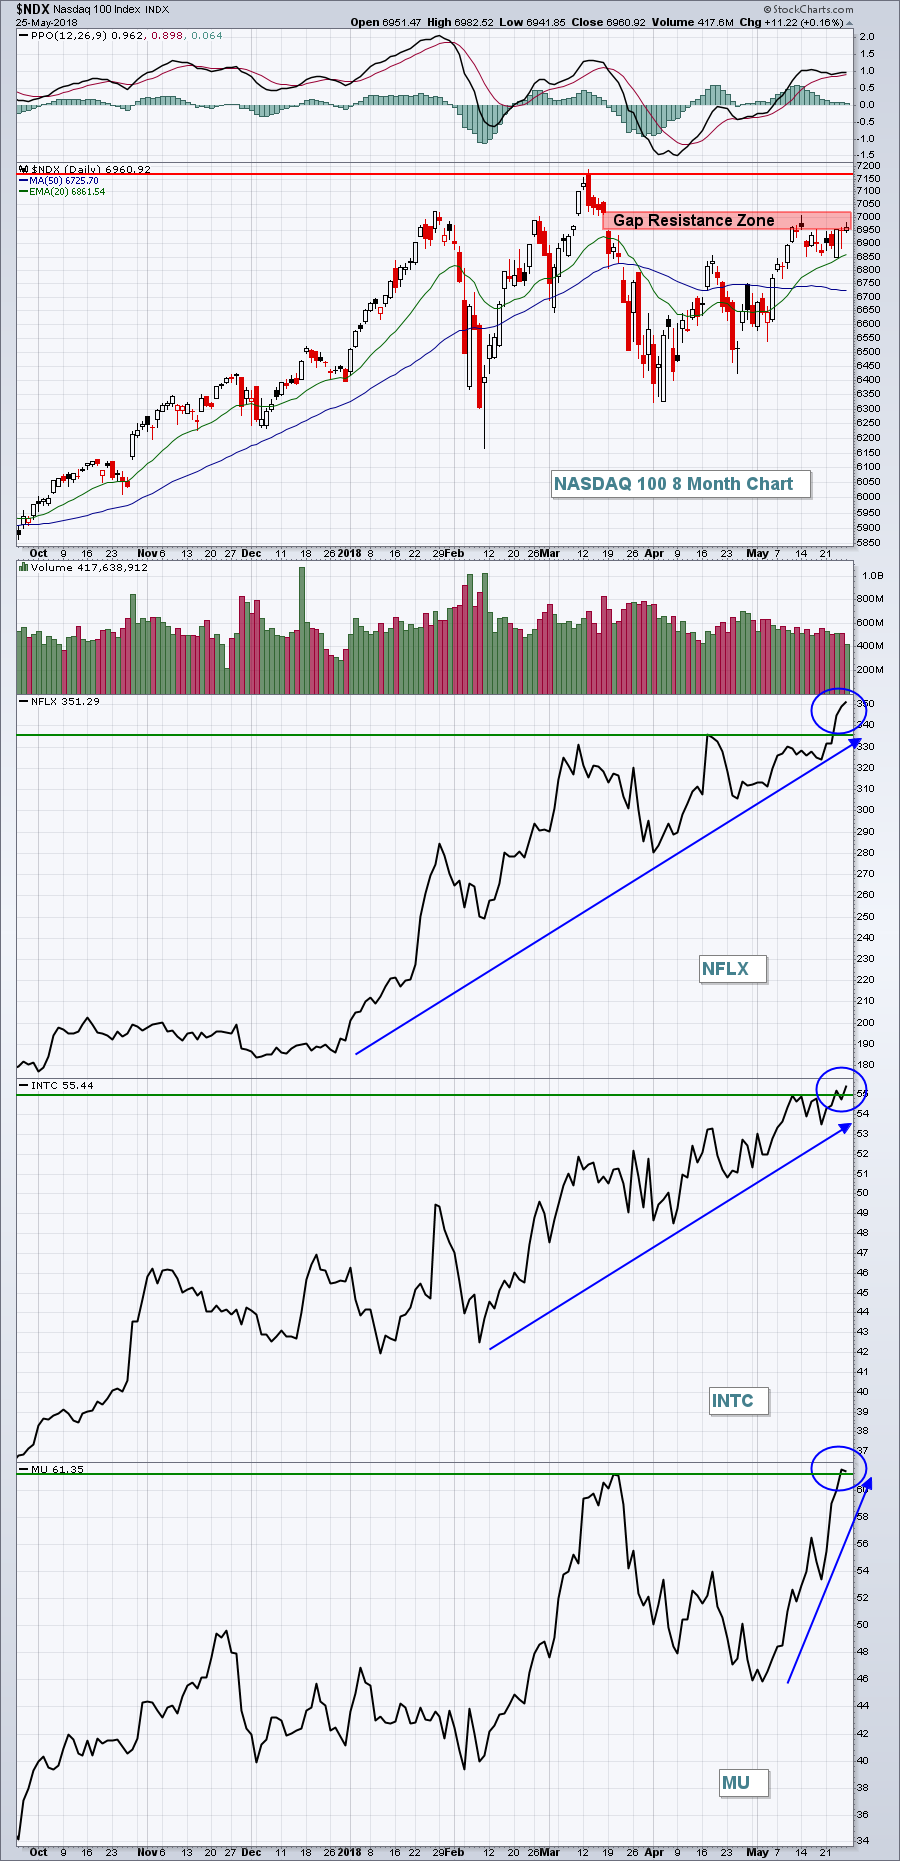
The NASDAQ 100 ($NDX) led the action on Friday and last week, thanks in large part to Netflix (NFLX) and a couple of chipmakers - Intel Corp (INTC) and Micron Technology (MU). NFLX surged to an all-time high earlier in the week, easily clearing overhead price resistance, and INTC followed suit by doing the same on Friday. MU is on the verge of such a breakout, gaining 33% in the past month alone, and nearing a $62 close, its highest since 2000:
 The NDX was the only major index to finish in positive territory on Friday, leading the bifurcated action. Utilities (XLU, +0.44%) and consumer staples (XLP, +0.16%) led as money rotated mostly toward defensive assets. The iShares 20+ year treasury bond ETF (TLT) closed at its highest level in more than a month, but is now facing serious overhead resistance in the form of gap and trendline resistance:
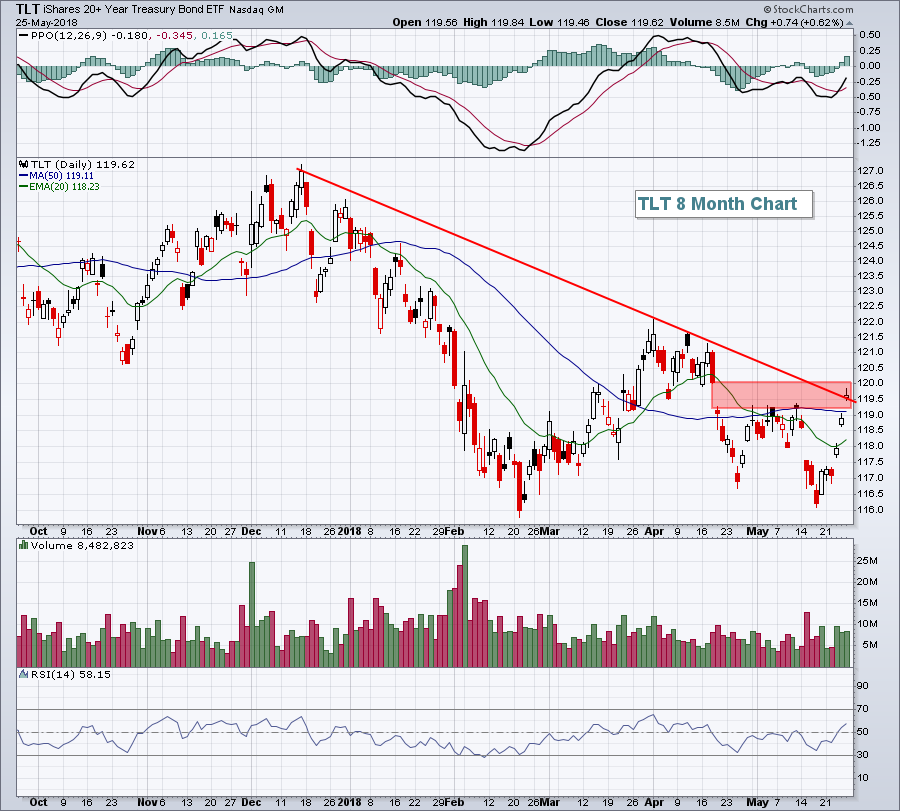 A break above this area of resistance still leaves overhead price resistance at 121.50-122.00. To reverse the 2018 downtrend, the TLT would need to clear that price level and hold.
Energy (XLE, -2.60%) was crushed on Friday after crude oil prices fell back below $68 per barrel. On Tuesday of last week, the WTIC had closed above $72 per barrel so the big drop in crude prices took its toll on energy shares. The XLE lost 4.52% last week.
Pre-Market Action
Italy is grabbing headlines with its political uncertainty, but the real story - at least in the short-term - is the rapidly declining 10 year treasury yield ($TNX), which is down another 5 basis points this morning to 2.88%. That is likely to spur more buying of defensive assets, continuing the theme from late last week.
Despite the sudden rise in fear and rotation to defensive assets, gold ($GOLD) is down this morning and struggling to clear $1300 per ounce resistance. Crude oil ($WTIC) is down another 1% and is nearing $67 per barrel, its lowest level during May. $66 per barrel is a fairly solid support level, so let's watch to see if that holds.
With 45 minutes left to the opening bell, Dow Jones futures are lower by 163 points.
Current Outlook
All of our major indices managed to post weekly gains, despite the weakness on Friday. Currently, price action on all major indices remains above key 20 period moving averages - the 20 day moving average on the daily chart and 20 week moving average on the weekly chart. That's a bullish setup. Throw in the positive, and strengthening, PPOs and it's a recipe for higher equity prices. I'd watch the transports ($TRAN) very closely. They broke above price resistance at 10800, then fell back briefly beneath this level only to hold rising 20 day EMA support. The TRAN then closed at another high on Friday. Railroads ($DJUSRR) and truckers ($DJUSTK) have been performing quite bullishly, but airlines ($DJUSAR) had been the laggard. That changed a bit on Friday as the DJUSAR spiked 2.76% and closed back above its 50 day SMA for the first time in more than two months:
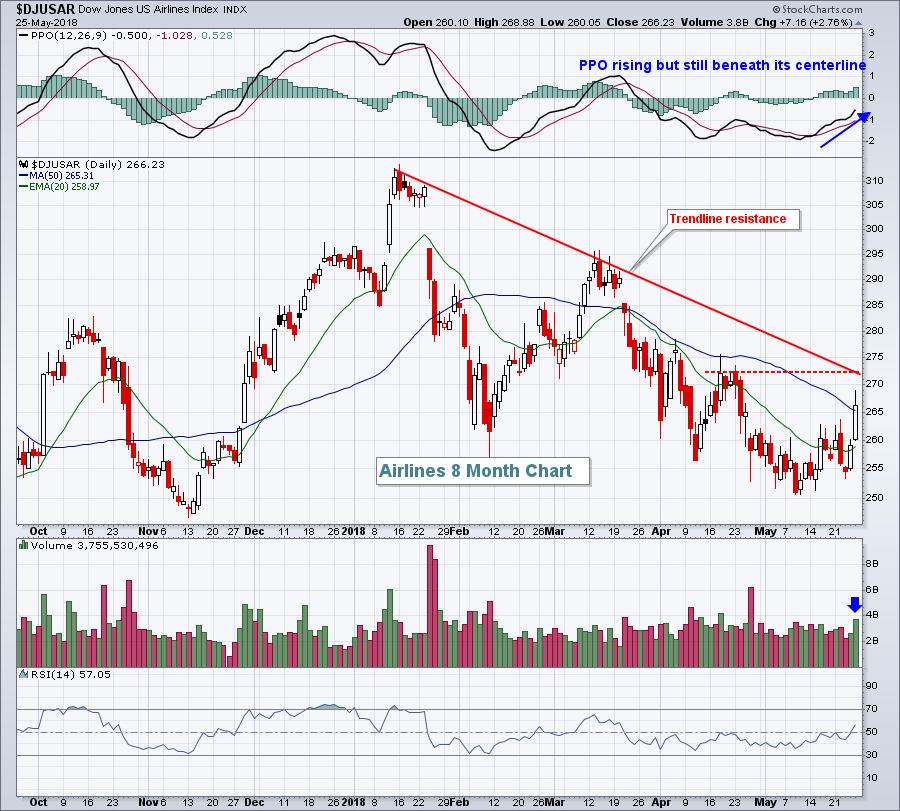 There's much more technical work to be done here though. First, note that the PPO remains beneath its centerline. It's difficult to argue there's bullish momentum when the PPO is in negative territory. Next, it appears the 272-273 area could prove to be a difficult one with trendline resistance and the most recent price high intersecting there. But there are other bullish signs to recognize. Check out that increasing volume on Friday's big surge. It was the heaviest daily volume in the group during May and it accompanied price action that cleared the gap resistance established in late-April.
While there are mixed signals for airlines, lower crude oil prices and an already strengthening transportation group suggest the likelihood of continuing improvement for the DJUSAR.
Sector/Industry Watch
The Dow Jones U.S. Home Construction Index ($DJUSHB) has suffered in 2018, mostly due to fears of rapidly accelerating interest rates. The 10 year treasury yield ($TNX) was at 2.40% at the end of 2017. But it's surged higher in 2018 and recently hit 3.11%, its highest level in nearly 7 years. That's taken a big toll on many homebuilder stocks and it's reflected in the 2018 downtrend:
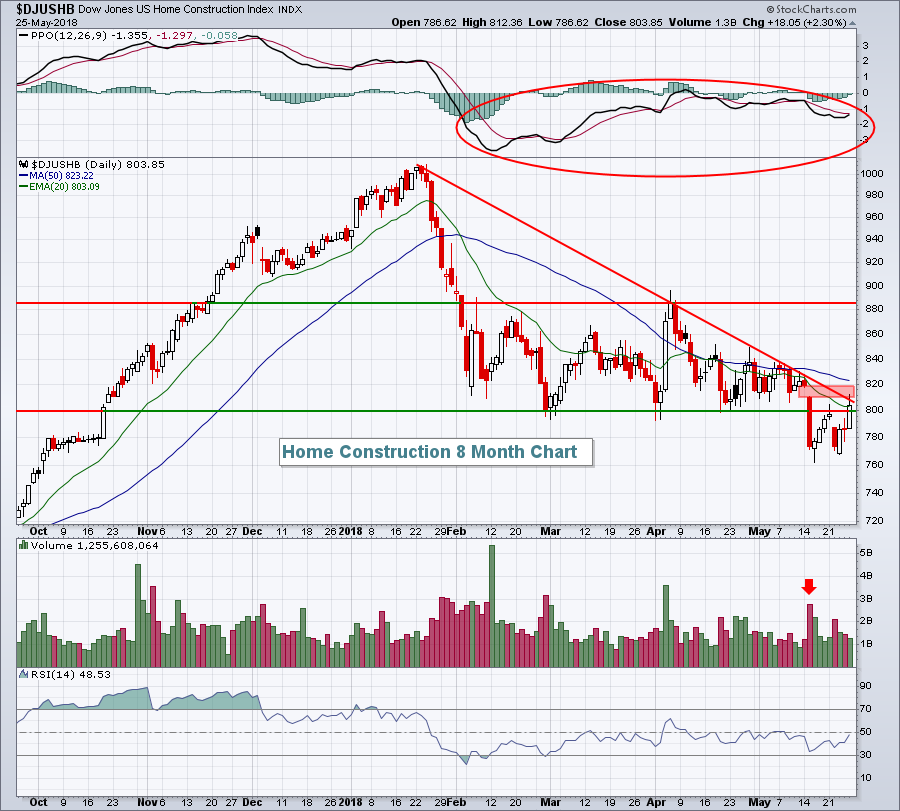 The PPO reflects extreme bearish momentum and the high volume breakdown beneath 800 confirms it. While Friday's push back above 800 would seem impressive, volume was light and price finished almost squarely on the declining 20 day EMA after failing to clear both trendline and gap resistance. The DJUSHB remains weak and I'd be careful with this group short-term.
Monday Setups
Energy took a big hit last week and some very strong individual stocks pulled back significantly. Among those was Parsley Energy (PE) which dropped more than 7% last week. But there was a significant reversal on Friday, with a hollow candle printing so I'm looking for a rebound here:
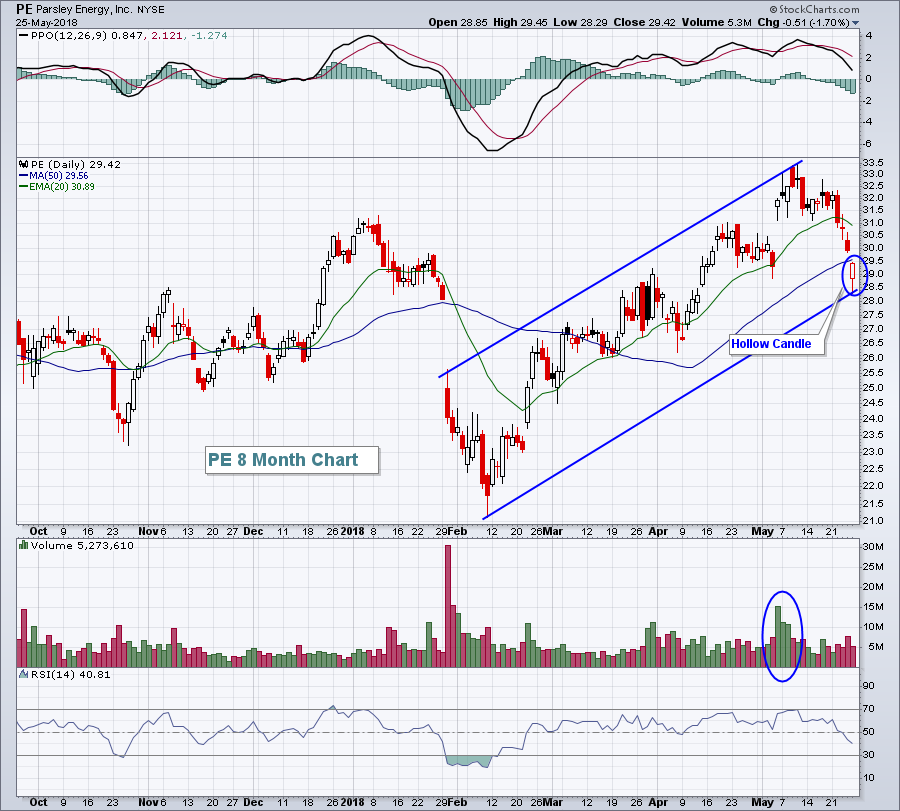 I'd look for a reversal off Friday's candle and a target in the 32.00-32.50 area with an intraday stop beneath Friday's low of 28.29.
Historical Tendencies
We are back in the calendar month's "sweet spot" for bullish price action. Today is May 29th and the 28th through 2nd of ALL calendar months produce exceptionally strong annualized returns on the Russell 2000 (small caps) since 1987. Here they are:
28th: +33.46%
29th: +63.26%
30th: +23.68%
31st: +75.45%
1st: +44.17%
2nd: +30.14%
Key Earnings Reports
(actual vs. estimate):
BNS: 1.35 vs 1.31
(reports after close, estimate provided):
CRM: .46
HPQ: .48
Key Economic Reports
March Case-Shiller HPI to be released at 9:00am EST: +0.7% (estimate)
May consumer confidence to be released at 10:00am EST: 128.1 (estimate)
Happy trading!
Tom
