Market Recap for Thursday, May 24, 2018
The U.S. stock market will be closed on Monday in observance of Memorial Day. Thanks to all of the veterans, current and past, for their service to our country. :-)
Wall Street traded much lower in the opening 90 minutes, then spent the remainder of the day trying to lessen the bearish blow. The Dow Jones was down close to 300 points just prior to 11:00am EST. But a steady march higher enabled the Dow to erase 75% of those earlier losses and finish the day down just 75 points. The Russell 2000, displaying relative strength once again, finished with a fractional gain.
Utilities (XLU, +0.82%) bounced for a fourth consecutive session as the 10 year treasury yield ($TNX) fell once again. The TNX has fallen from 3.10% to 2.98% in one week (it's down another 3 basis points in pre-market action today) and that's no doubt providing a short-term lift to utilities. Industrials (XLI, +0.49%) were led by transports ($TRAN) as its three top performing industry groups were airlines ($DJUSAR, +1.76%), truckers ($DJUSTK, +1.50%) and railroads ($DJUSRR, +1.32%). The latter two have fairly bullish charts, especially the DJUSRR, but it's been a different story for the DJUSAR. The good news, however, is that the DJUSAR is bouncing from a key support level on its longer-term weekly chart:
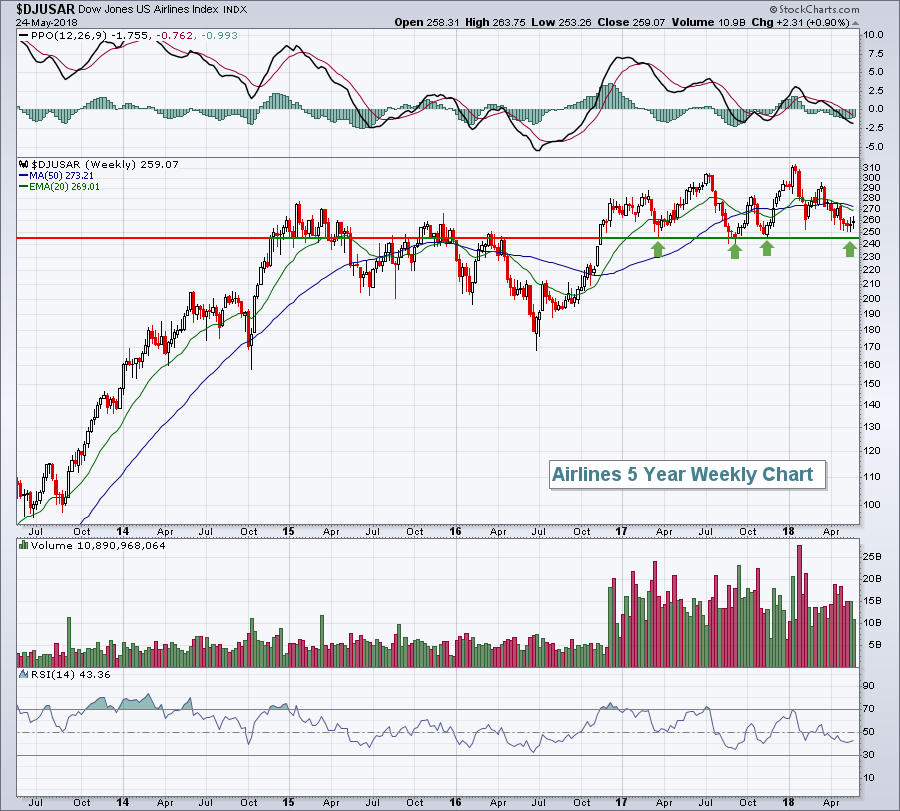 The 240-250 support zone has held on multiple occasions and should be considered significant support. Failure to hold that level could lead to much more selling in airlines. Buying near support, though, provides great reward to risk trades. If you believe the economy is strengthening, adding airlines close to long-term support makes sense.
Energy (XLE, -1.64%) continued its slide this week and successfully tested its rising 20 day EMA support:
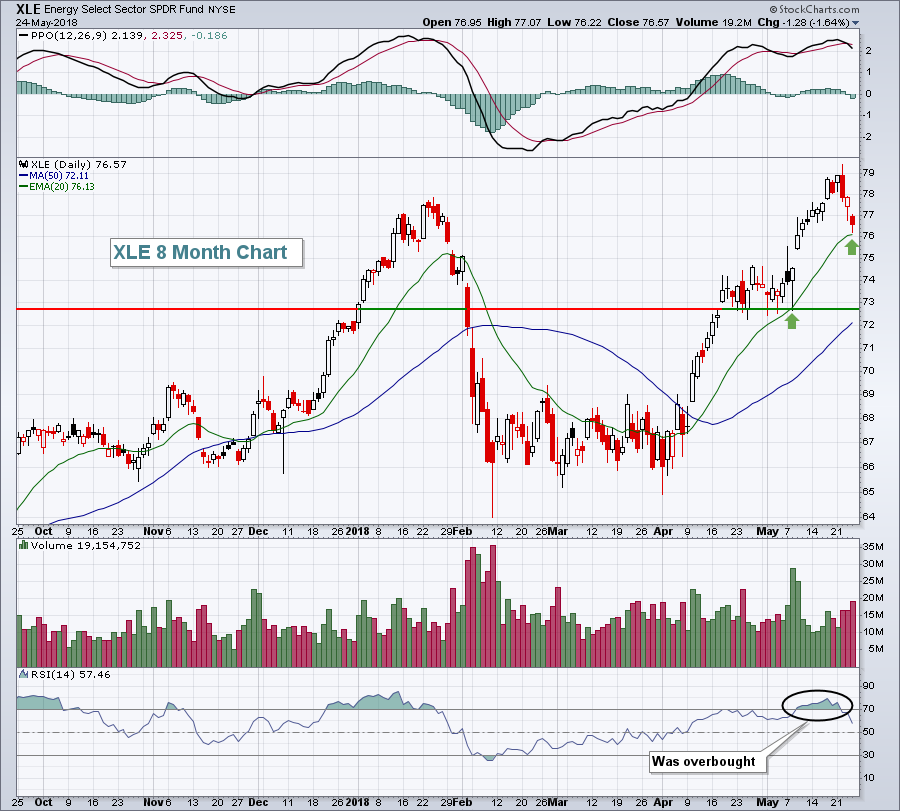 The XLE was very overbought short-term, as evidenced by an RSI reading near 80. The selling this week is providing much-needed relief. The two key levels of support are the 20 day EMA, currently at 76.13, and price support in the 72-73 range.
Pre-Market Action
Gold ($GOLD) is down slightly this morning after testing a key area of overhead resistance on Thursday:
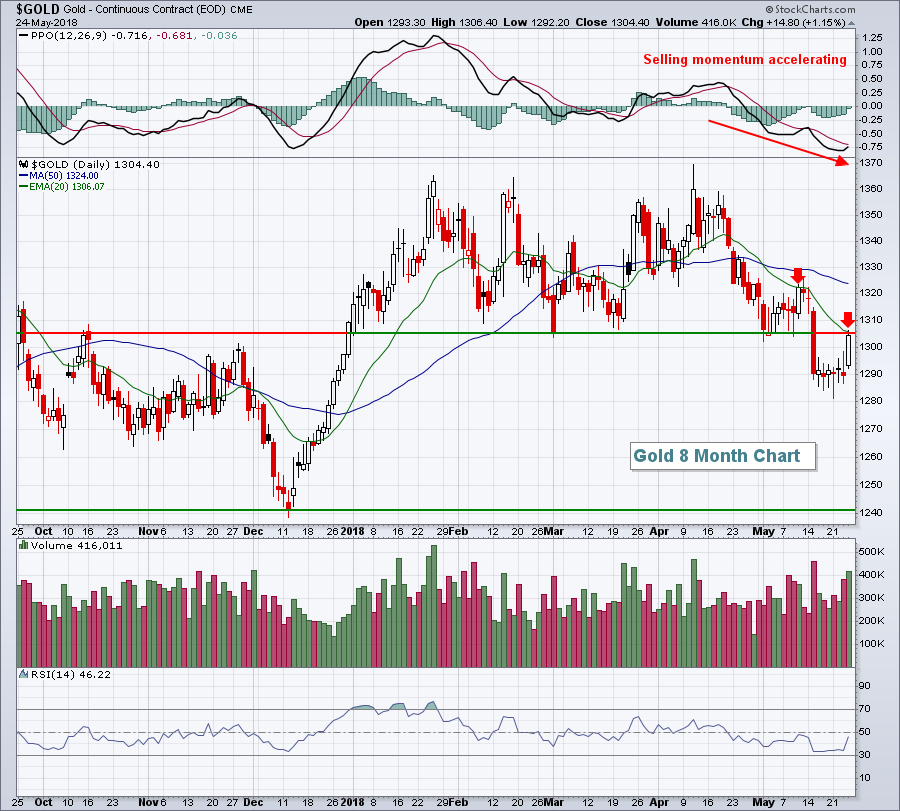 It's typical for rallies to fail at the declining 20 day EMA during downtrends, especially with selling momentum accelerating (new PPO low on most recent price low). The U.S. Dollar Index ($USD) has been very strong and, if that continues, I'd look for new lows ahead for GOLD.
Crude oil ($WTIC) is tumbling today, down 2.74% to $68.77 per barrel at last check. That will not help an energy group that's already seen a lot of profit taking this week. We'll likely see the XLE trade beneath its 20 day EMA today, so let's watch to see if it can hold that moving average at the close.
Dow Jones futures are down 59 points as we prepare for the last trading day of the week.
Current Outlook
Performance of retail stocks is an important gauge of U.S. economic strength. Retailers perform well during periods of economic strength. The well-diversified retail ETF (XRT) has been consolidating in bullish fashion for more than three years. It hasn't broken down, but it hasn't been soaring either. This lengthy period of consolidation follows a huge rally that took place in the XRT from the beginning of the bull market in 2009 through early 2015. Since then, money has been rotating into other areas of the stock market. That appears to be changing. In the Sector/Industry Watch section below, apparel retailers broke out yesterday. Clothing & accessories ($DJUSCF) also broke out. Footwear ($DJUSFT) has broken out. Specialty retailers ($DJUSRS) have broken out. Others are closing in on breakouts. The XRT hasn't made a breakout above its January high, but the bullishness on the daily chart of late is quite apparent:
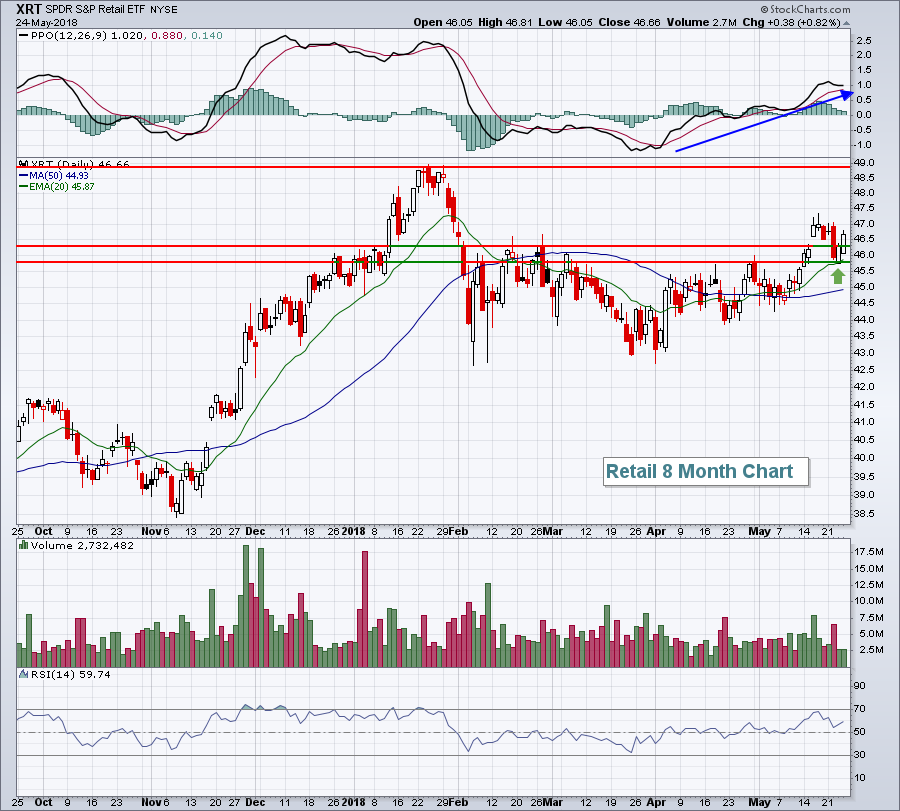
The PPO is accelerating higher and the latest pullback held 20 day EMA support - both signs of a trending ETF. The short-term bullishness, however, is part of a much larger bullish rectangular consolidation pattern that should eventually resolve itself to the upside:
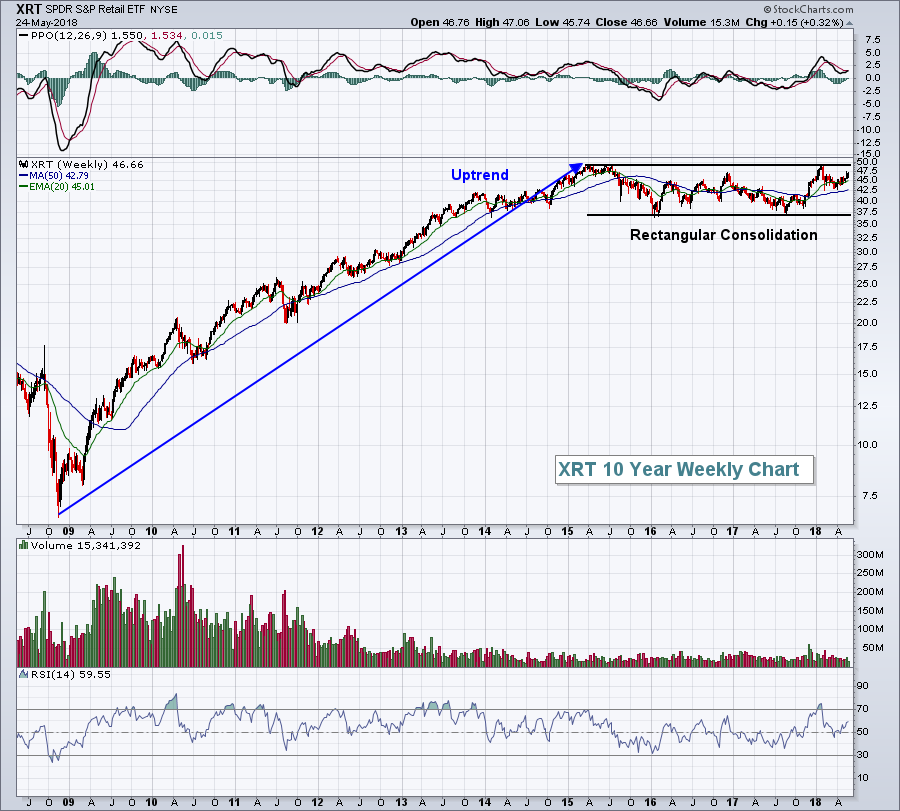 I expect to see leadership from retail during the balance of 2018, especially if the XRT can sustain its strength through a breakout of the 50 resistance level.
Sector/Industry Watch
The Dow Jones U.S. Apparel Retailers Index ($DJUSRA) broke out on Thursday to close at its highest level in more than three years as it approaches its all-time high close at 906.33 on March 30, 2015:
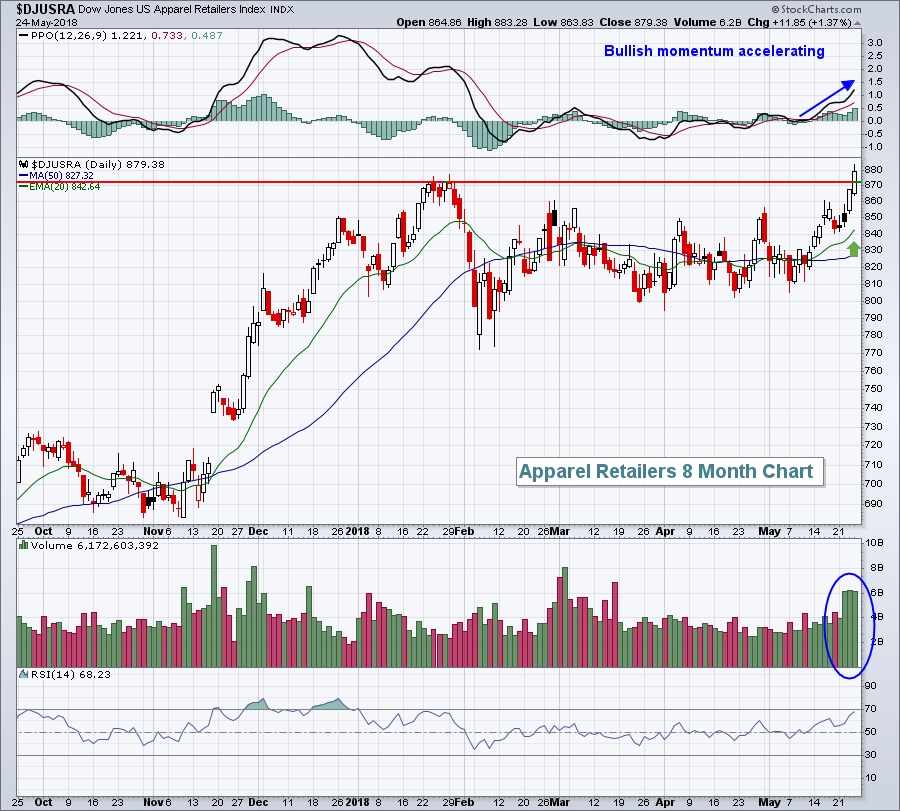 The stock market is one of the best, if not the best, leading indicators of our economy. Volume in this space is increasing and price momentum is bullish and accelerating. What does this say about the stock market's expectations of our domestic economy moving into summer and the second half of 2018? I say our economic picture continues to improve, not the ingredient you're looking for if you have a bearish stance.
Historical Tendencies
After the close today, Wall Street turns to a seasonally bullish period. The following are the NASDAQ annualized returns since 1971 for each of calendar days within the period (May 26 through June 5):
May 26 (Saturday): +69.37%
May 27 (Sunday): +139.95%
May 28 (Monday - Memorial Day): +50.81%
May 29 (Tuesday): -42.08%
May 30 (Wednesday): +33.43%
May 31 (Thursday): +16.98%
June 1 (Friday): +65.17%
June 2 (Saturday): +113.56%
June 3 (Sunday): -47.15%
June 4 (Monday): +59.92%
June 5 (Tuesday): +85.75%
Key Earnings Reports
(actual vs. estimate):
FL: 1.45 vs 1.25
Key Economic Reports
April durable goods released at 8:30am EST: -1.7% (actual) vs. -1.2% (estimate)
April durable goods ex-transports released at 8:30am EST: +0.9% (actual) vs. +0.6% (estimate)
May consumer sentiment to be released at 10:00am EST: 99.0 (estimate)
Happy trading!
Tom


