Market Recap for Wednesday, July 18, 2018
We were mostly higher on Wednesday, although gains were slight. One exception was the NASDAQ, which finished less than one point lower. Otherwise, we saw green. Despite mostly higher prices, leadership really came from just two sectors - financials (XLF, +1.60%) and industrials (XLI, +1.10%). It's been awhile since we talked about leadership from these two sectors as the 10 year treasury yield ($TNX) has consolidated after a major run higher to open 2018. Negative trade headlines have also impacted industrials in a mostly bearish way. But on Wednesday, the tables turned if even for just one day.
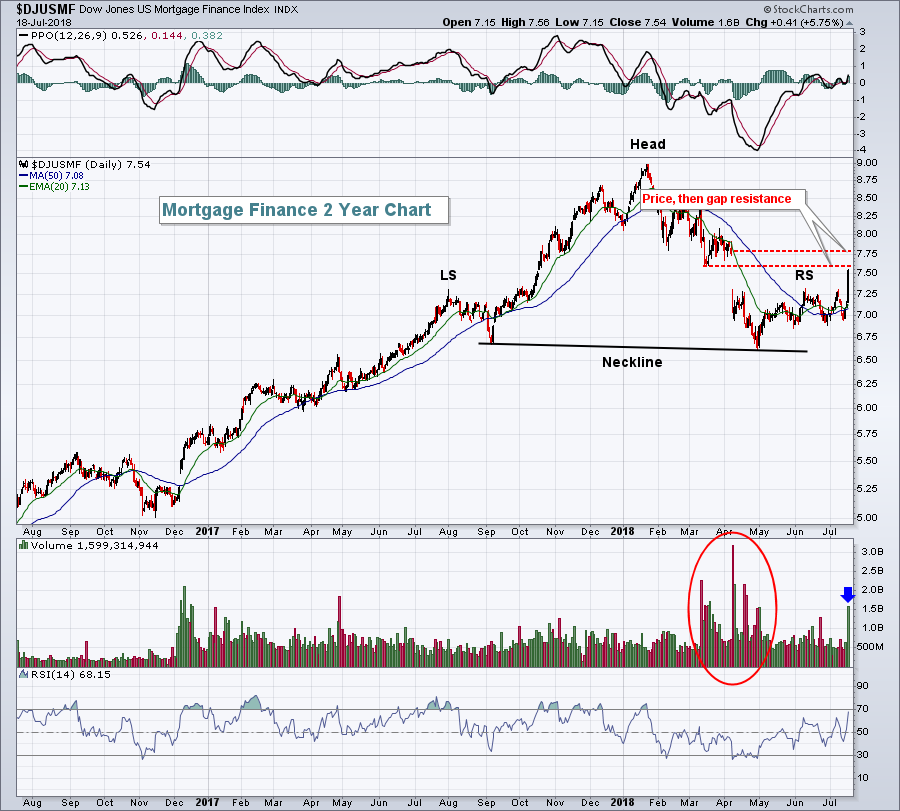
Mortgage finance ($DJUSMF) was very strong and completely reversed what appeared to be a very bearish chart. I recently highlighted this group, discussing its bear flag and high probability of moving lower. Technical analysis, though, is not a guarantee. Instead, I use it to manage risk. When a group looks weak technically, I avoid it until the chart changes. The DJUSMF changed yesterday:
 The high volume (blue arrow) break above what was clearly right shoulder resistance is a positive first step for this industry. Could we turn back down? Sure, but the bears were completely in control until yesterday. Now we have a PPO that's turned positive and more bullish price momentum. And let's keep in mind we're in a bull market that looks to me like it's begun another leg higher. It's hard to be a bear.
Transports ($TRAN, +2.29%) led the industrials to the upside. Railroads ($DJUSRR, +3.59%) and airlines ($DJUSAR, +3.36%) were particularly strong as key components of both groups posted much better-than-expected quarterly results. United Continental (UAL, +8.79%) and CSX Corp (CSX, +7.08%) led the transport rally with excellent earnings.
One day after leading the stock market higher, materials (XLB, -0.93%) were the primary laggard. Consumer staples (XLP, -0.81%) also performed poorly as brewers ($DJUSDB, -3.95%) were led lower by Molson Coors (TAP), which fell nearly 4%.
Pre-Market Action
U.S. futures are under pressure as the dollar ($USD) and 10 year treasury yield ($TNX) rises this morning. Gold ($GOLD) is having a rough start to the day as it tumbles another 16 bucks.
Overnight, Asian markets felt slight losses, while in Europe this morning, markets there are mixed.
Economic reports this morning were quite positive, as were quarterly earnings. A notable exception, however, was The Travelers Cos (TRV), which is down 3% in pre-market action after falling well short of its EPS estimate.
Current Outlook
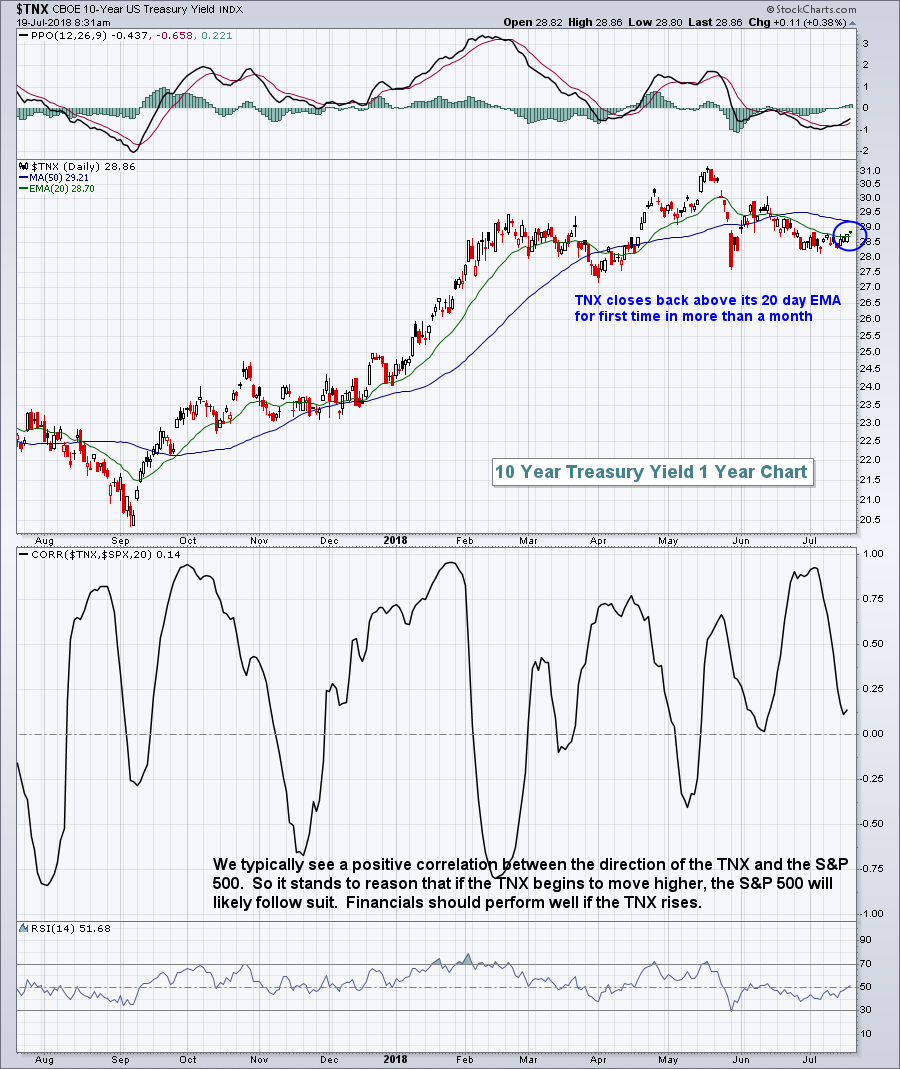
I've been watching the 10 year treasury yield ($TNX), awaiting a breakout above its declining 20 day EMA to perhaps signal rotation away from bonds and into equities, or at least into the beaten-down financials. We finally saw a close and breakout above the 20 day EMA, albeit a very slight one:
 In early action this morning, the TNX is up another basis point and could be pulling away from its 20 day EMA - a positive for financials.
Sector/Industry Watch
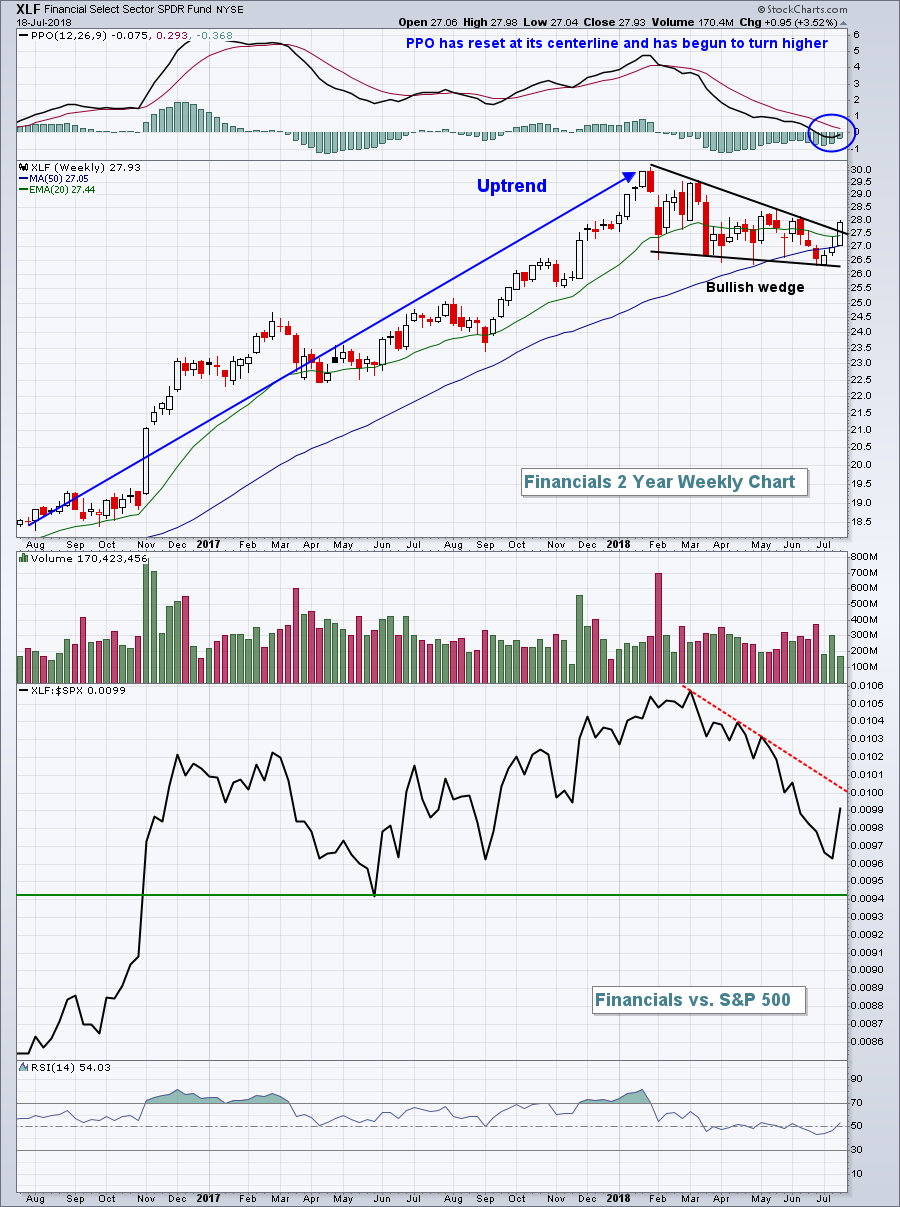
Financials had been lagging the S&P 500 quite badly since the end of February, but that may be changing given the XLF's apparent breakout of a bullish wedge. This week's close will be critical as the following chart is weekly:
 Financials led the stock market higher during the late 2017 to early 2018 rally as their rising relative ratio highlights above. Given the slight breakout yesterday in the TNX, financials could be poised to regain its leadership on a longer-term basis.
Historical Tendencies
Yesterday started the most bearish historical period of the year. Many market pundits reference the "go away in May" theory, but there are plenty of bullish statistics from May through mid-July. Beginning July 18th, however, market tendencies do turn more bearish. Since 1950 on the S&P 500, the July 18th through September 26th period has produced annualized returns of -2.45%. That's more than 11 percentage points beneath the S&P 500's average annual return of 9% over the past seven decades. I am NOT saying that the S&P 500 is guaranteed to move lower between now and September 26th. I'm simply providing the historical facts that suggest this is the worst time to be long stocks.
Key Earnings Reports
(actual vs. estimate):
ABB: .37 vs .36
BBT: 1.01 vs 1.01
BK: 1.03 vs 1.03
DHR: 1.15 vs 1.09
PM: 1.41 vs 1.23
PPG: 1.90 vs 1.89
RCI: .83 vs .79
SAP: 1.17 vs 1.18
TRV: 1.81 vs 2.43
TSM: .47 vs .45
UNP: 1.98 vs 1.94
(reports after close, estimate provided):
COF: 2.63
ISRG: 2.48
MSFT: 1.07
Key Economic Reports
Initial jobless claims released at 8:30am EST: 207,000 (actual) vs. 220,000 (estimate)
July Philadelphia Fed Survey released at 8:30am EST: 25.7 (actual) vs. 22.0 (estimate)
June leading indicators to be released at 10:00am EST: +0.4% (estimate)
Happy trading!
Tom


