Market Recap for Friday, July 20, 2018
Software ($DJUSSW, +0.86%) led once again on Friday, thanks in large part to another impressive quarterly earnings report from technology (XLK, +0.03%) giant Microsoft Corp (MSFT). It was a fairly narrow technology advance as software and internet ($DJUSNS, +0.25%) were the only two technology industries to gain ground. In fact, leadership from Friday came in the form of consumer staples (XLP, +0.61%), which benefited from a powerful rally in tobacco stocks ($DJUSTB, +2.84%). Philip Morris (PM, +4.22%) surged to close at its highest level since its earnings fiasco in April:
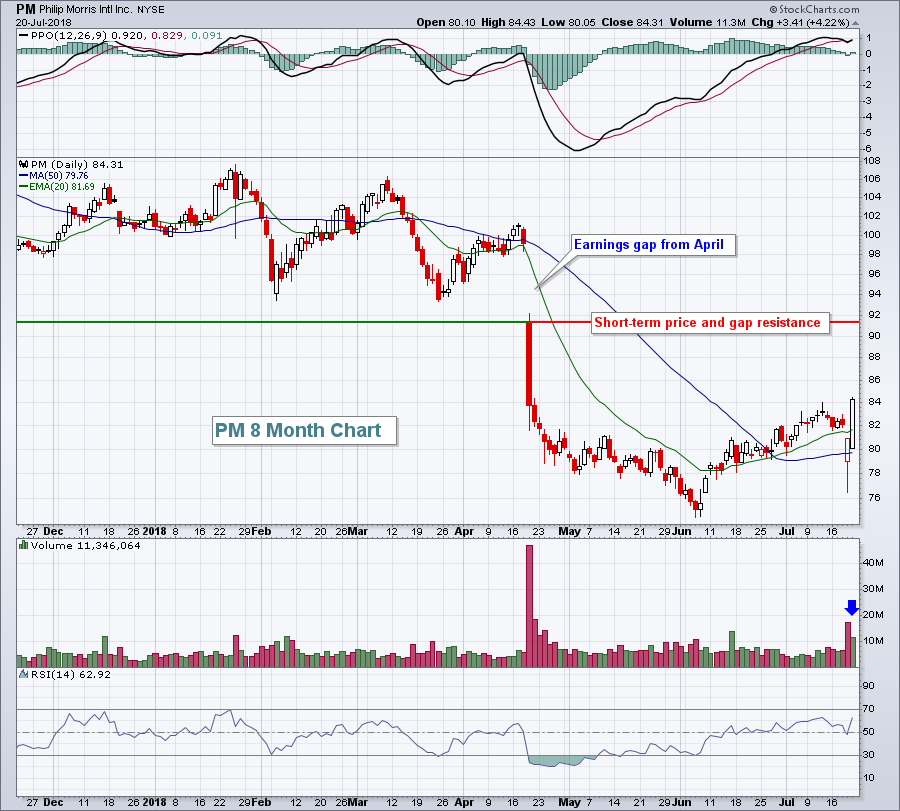 After an initial reaction lower, price support held and PM rebounded strongly on Friday. I'd expect to see PM make a run higher to price and gap resistance just above 91. Then we'll likely see more sellers appear.
Despite the strength in PM and consumer staples, our major indices finished with minor losses on Friday as traders gauge the earnings reports from last week and the increasing number of earnings reports due out this week. Alphabet (GOOGL) reports after the bell tonight.
Another defensive group - utilities (XLU, -0.70%) - struggled and trailed the other sectors Friday as the 10 year treasury yield ($TNX) closed above its 20 day EMA for the second time in the last three trading days. A rising TNX typically sends utilities traders for the exits as their dividends look less appealing.
Pre-Market Action
The 10 year treasury yield ($TNX) has climbed back above 2.90% this morning for the first time in a month and it appears an uptrend is underway. Crude oil ($WTIC) is up 1.35% and back above $69 per barrel. Asian markets were mixed, although the Tokyo Nikkei ($NIKK) fell more than 300 points as the dollar weakened further vs. the yen. European markets are lower, which could prove problematic for the U.S. market today.
Currently, however, Dow Jones futures are flat as the opening bell approaches.
Current Outlook
The NASDAQ could have troubles this week. In addition to the next couple days being very bearish from a historical perspective, it didn't help to see a leader like MSFT post a reversing black candle after an uptrend:
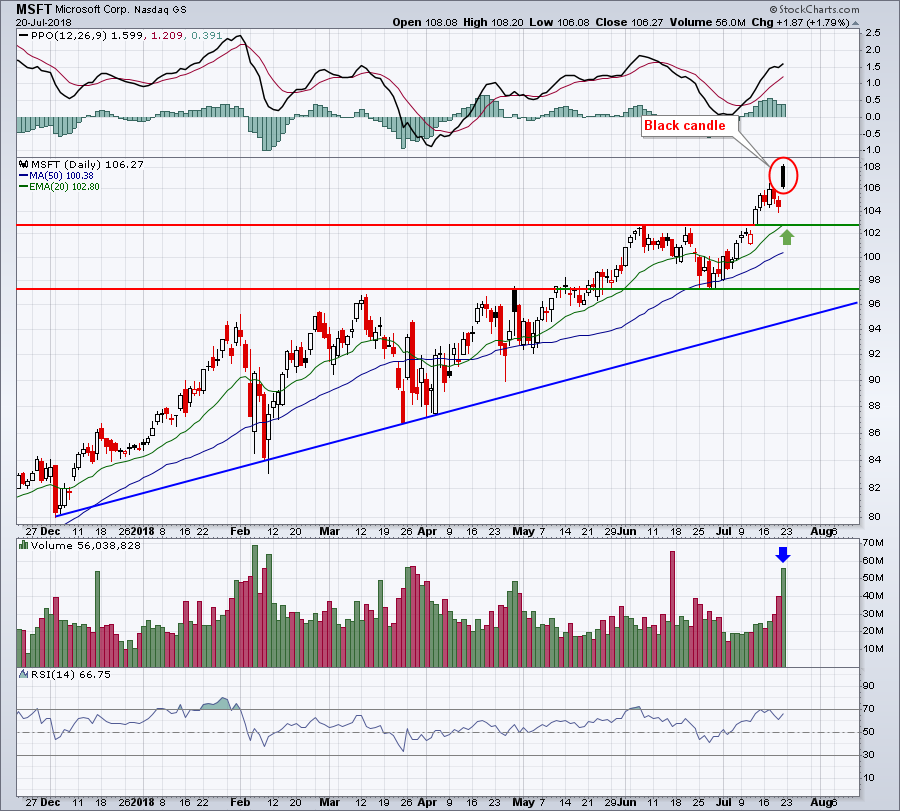 Software has been a leading component within technology, but the MSFT chart suggests we could see some short-term consolidation in this space. That suggests that future strength could be dependent upon the GOOGL earnings report, out after the bell tonight.
Sector/Industry Watch
The Dow Jones U.S. Medical Equipment Index ($DJUSAM) has been leading both healthcare and the overall market higher. Leadership is evident from the following chart:
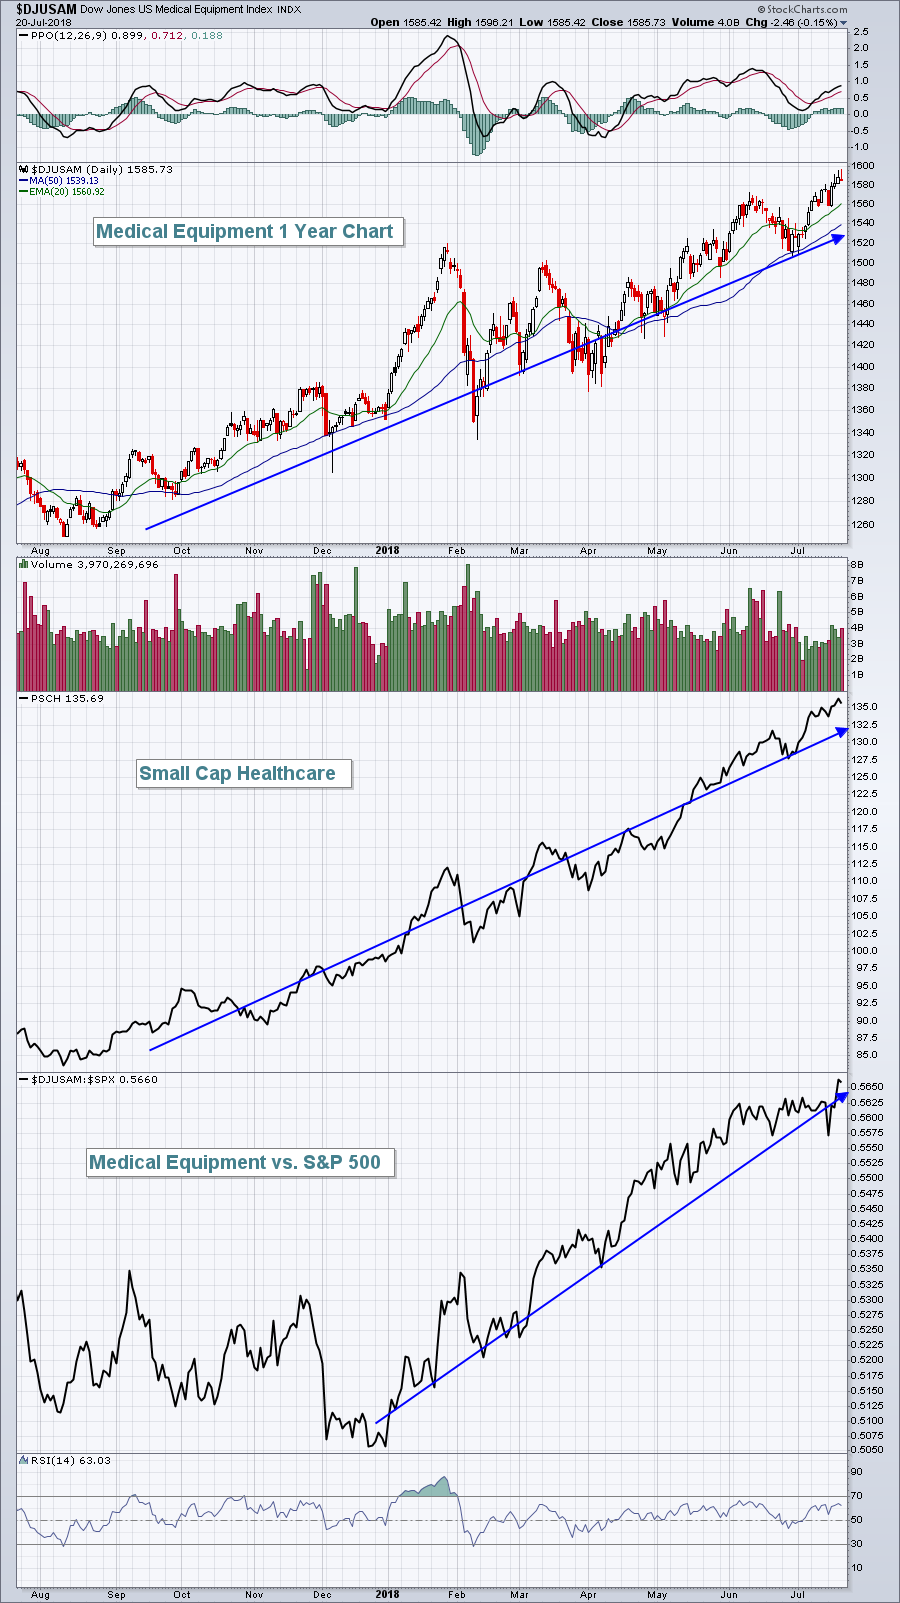 The strength shown in the above chart is one big reason why I like Wright Medical Group (WMGI) as my Monday setup for a second straight week. More on WMGI below in my Monday Setups section.
Monday Setups
For a second straight week, I'm going to stick with WMGI. It's done very little since I featured this stock last Monday, but it continues to consolidate in a bullish wedge as it works its way back toward gap support. I like accumulation from the current price down to 24.68 with a fairly tight stop, perhaps a close beneath 24.50:
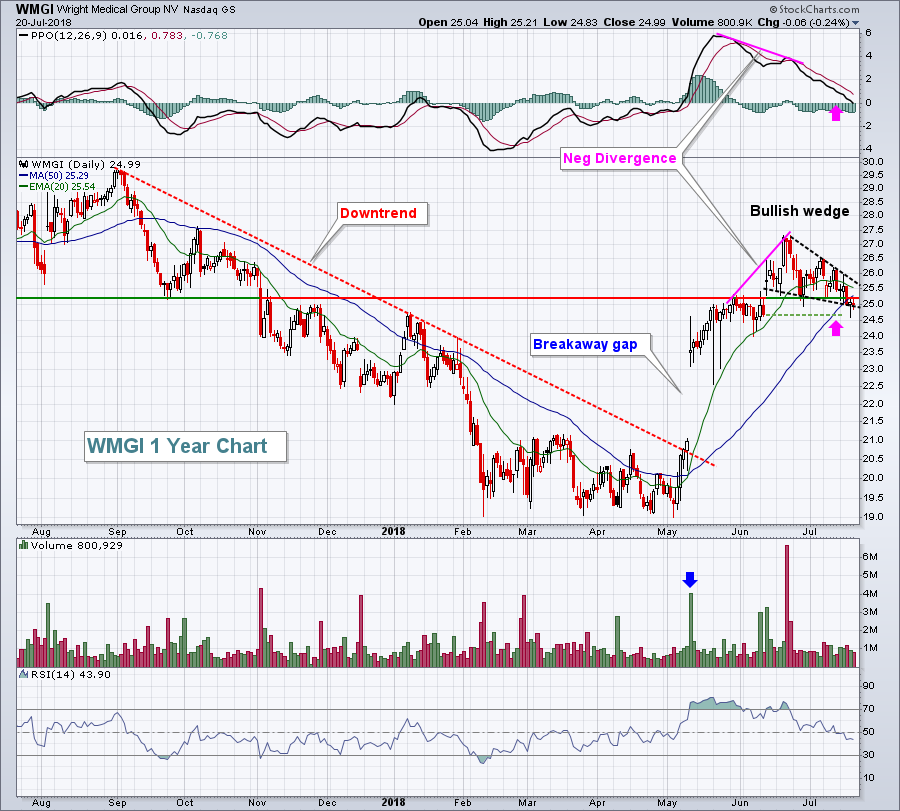 This is the same chart and annotations I posted last Monday. The only change that I made was to add the black dotted lines to highlight the bullish wedge. Note that the pink arrows suggested a potential upcoming 50 day SMA test, along with a possible PPO centerline test. We saw both of those late last week that included a gap support test (green dotted line).
It was just two months ago that WMGI posted revenues and EPS that both easily exceeded Wall Street expectations. It also fits that bullish small cap healthcare theme that has been sending stocks within this area higher. Don't be surprised if we begin to see a pre-earnings march higher as its August earnings date approaches.
(Disclosure: I own WMGI shares)
Historical Tendencies
We are in the midst of a very bearish week historically and it runs through tomorrow's close (July 24th). Since 1971 on the NASDAQ, July 23rd has ranked as the second worst calendar day of the year, producing an annualized return of -103.65%, topped only by November 19th's -111.83% return.
There have been 32 days that the stock market has been open on July 23rd since 1971 and the breakdown between up and down days is 16 up and 16 down. So what this means to me is that when the NASDAQ rises on July 23rd, it's typically a minor gain, but when it goes down, it has the tendency to go down hard.
Key Earnings Reports
(actual vs. estimate):
HAL: .58 vs .59
HAS: .48 vs .29
ITW: 1.97 vs 1.98
(reports after close, estimate provided):
AMTD: .79
CDNS: .40
GOOGL: 9.51
Key Economic Reports
June existing home sales to be released at 10:00am EST: 5,450,000 (estimate)
Happy trading!
Tom


