Market Recap for Tuesday, August 28, 2018
U.S. stocks extended their winning streak deeper into record territory on Tuesday. The S&P 500 closed in record territory for the third consecutive session. While the gain was very slight (+0.03%), it still keeps the bulls in charge - at least for now. We also saw the other major indices finish with fractional gains as consumer discretionary (XLY, +0.20%) and technology (XLK, +0.17%) helped to pace the small advance. It was truly a day of consolidation as even the worst sectors - energy (XLE, -0.43%) and materials (XLB, -0.38%) - simply gave back a bit of their profits from the past week. The XLE and XLB had both been leaders over the past week as our indices cleared price resistance and broke to all-time highs.
A familiar name within the XLY led the group higher. Clothing & accessories ($DJUSCF, +0.64%) staged a rally after again approaching its rising 20 day EMA. It has a PPO on the rise and it's likely just a matter of time before a new high is set:
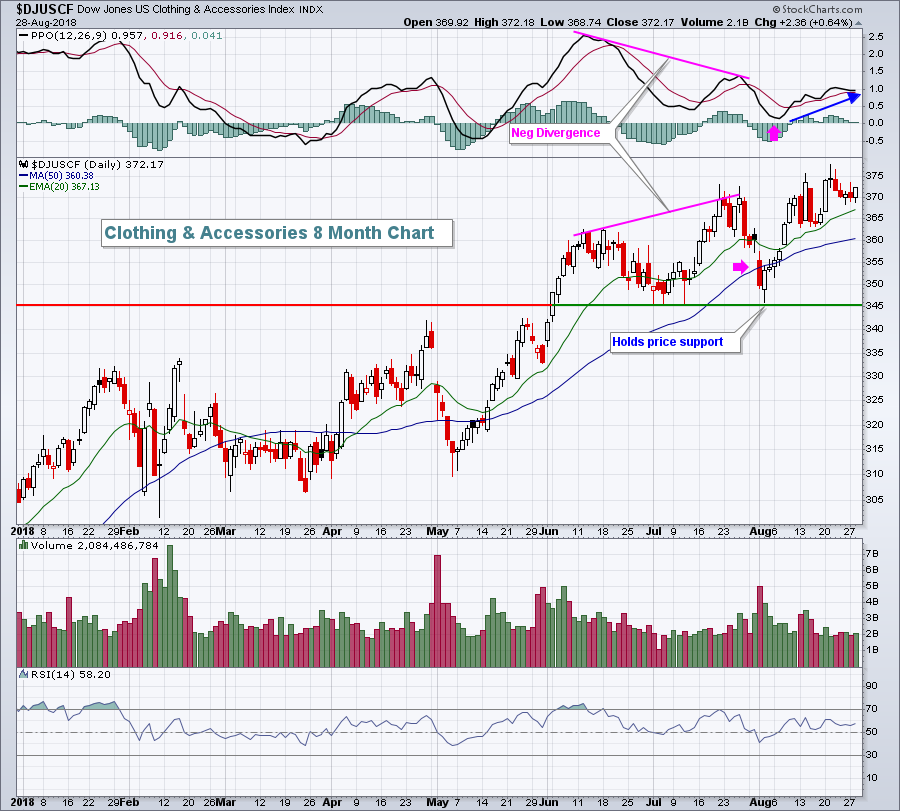 There was a negative divergence on the July price high as the PPO failed to come close to generating a new high. That resulted in weakness to help "reset" momentum (PPO) at zero and to test the 50 day SMA. But a reversing dark cloud candle printed there - and just above key price support - before the DJUSCF resumed its prior uptrend. Now the PPO is on the rise again and likely to make a breakout, holding rising 20 day EMA support on any pullbacks.
But it was a mixed market just about everywhere and autos ($DJUSAU) was one area within consumer discretionary that didn't fare so well. It failed to hold onto its 20 day EMA, losing 1.6%. A 2.3% drop in Tesla shares (TSLA) was the primary culprit as TSLA CEO Elon Musk said the auto company is no longer considering going private.
Pre-Market Action
The 10 year treasury yield ($TNX) is flat this morning and resting at 2.88%, but that is slightly above its 20 day EMA, at least an initial positive. Gold ($GOLD), which had been rallying of late with a weakening U.S. Dollar Index ($USD), is down $5 to $1210 per ounce as the USD attempts to halt its recent slide.
Asian markets were fractionally higher overnight, while European markets are mixed this morning. The 2nd estimate of Q2 GDP was released this morning and it came in higher than expected (4.2% vs 4.0%), but futures are rather muted here in the U.S. Dow Jones futures are down 10 points with roughly 30 minutes left to the opening bell.
Current Outlook
Currently, the breakout into record territory is quite bullish for U.S. equities in the very near-term. It's difficult to argue with all-time highs, especially those that are accompanied by "beneath the surface" bullish signals and that's exactly what we have, in my opinion. But, like any other advance, we do get short-term warning signs from time to time in the form of 60 minute negative divergences. Typically they require a few days of selling to unwind those short-term price momentum issues. The 60 minute PPO remains bullish for now, but another breakout in the NASDAQ would likely result in a negative divergence printing and, thus, short-term market risk growing:
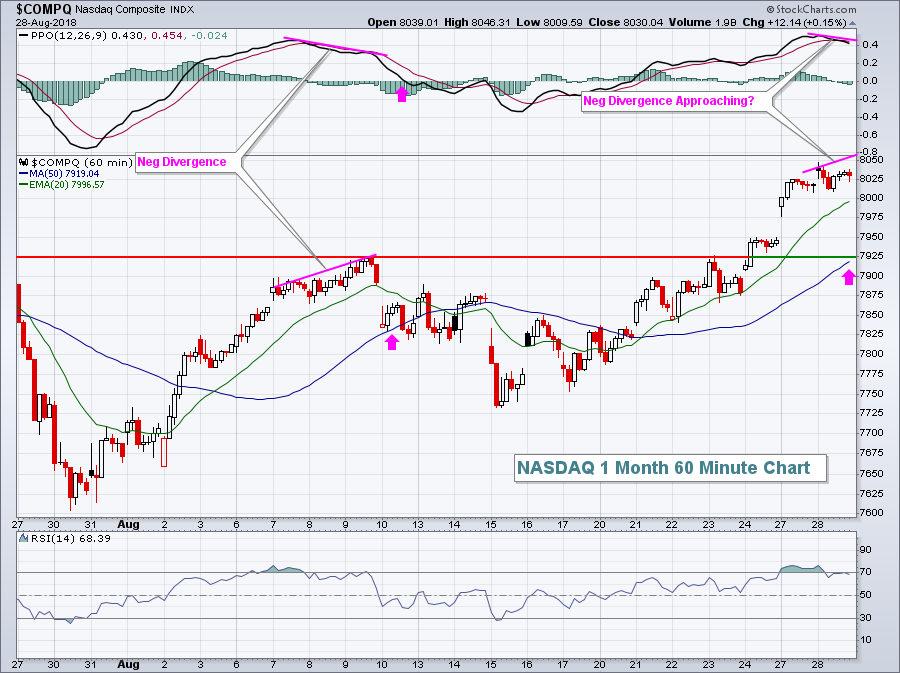 So long as the PPO rises to new highs to match the price highs, there are no momentum issues. But if we see the PPO fail to set new highs to accompany those price highs, risk begins to increase that we'll see minimally a bout of short-term profit taking. A perfect example of this occurred approximately three weeks ago and selling ensued for the next four trading sessions. When I see a 60 minute negative divergence print, I look initially for PPO centerline and/or 50 hour SMA tests, both of which were seen the very next trading day. From there, it's a bit more questionable whether the market heads lower or resumes its prior uptrend. I point all of this out because the NASDAQ is likely to see a negative divergence emerge on its next price high. While that NEVER guarantees us that selling is coming, it certainly increases the risk of it. Managing risk is a major component of successful short-term trading. Therefore, steps should be considered to minimize risk on the next NASDAQ price high - especially if we begin to see other corroborating signals. A reversing candle on the daily chart would be such a short-term signal.
Sector/Industry Watch
Retail stocks (XRT) have performed exceptionally well in 2018, helping to lead the strong relative performance of consumer discretionary stocks throughout the year. While pullbacks should be expected from time to time, I see little to worry about in this space longer-term:
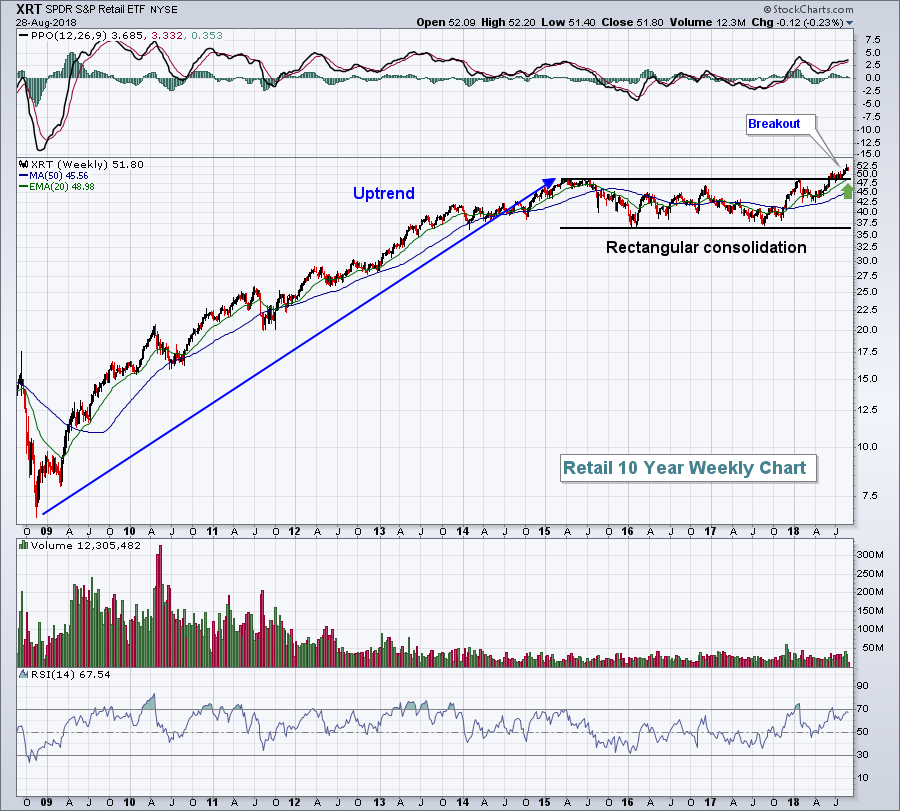 There was a long-term uptrend in play from the bear market low in 2009 through the high in early 2015, then the XRT consolidated for more than three years before breaking out in 2018. I view this breakout very bullishly and expect retail stocks to be among the market leaders for the foreseeable future.
Historical Tendencies
September is the worst calendar month for both the S&P 500 (since 1950) and NASDAQ (since 1971) performance. For the Russell 2000 (since 1987), September has only outperformed July and August. Annualized returns in September are negative for all three indices.
Key Earnings Reports
(reports after close, estimate provided):
CRM: .47
PVH: 2.11
Key Economic Reports
Q2 GDP (2nd estimate) released at 8:30am EST: 4.2% (actual) vs. 4.0% (estimate)
July pending home sales to be released at 10:00am EST: +0.0% (estimate)
Happy trading!
Tom


