Market Recap for Monday, August 27, 2018
It was an all-around solid day on Wall Street to begin the final week of August. And it all occurred on Monday, which historically has been the worst calendar day of the week, particularly Mondays that fall during the second half of calendar months. But technical conditions trump all things historical and on Friday we saw the S&P 500, NASDAQ and Russell 2000 close at all-time highs. Buyers were ready and willing at the open yesterday and I only saw one negative as the day progressed. All four major indices finished with gains, but much of the earlier gains in the small cap Russell 2000 evaporated by day's end. The U.S. Dollar Index ($USD) fell for the 7th time in the last 8 days and that may have been weighing on traders' minds as money rotated away from small caps. Remember that the Russell 2000 was the primary beneficiary when the USD was surging higher, so it only makes sense to see underperformance in that index when the dollar struggles. I still expect to see the dollar rise much further during the balance of 2018, but only time will tell if that's the case.
From a sector perspective, utilities (XLU, -0.61%) was the only sector to lose ground. Consumer staples (XLP, +0.06%) - another defensive group - also struggled on a relative basis, but did manage to finish with a gain. Materials (XLB, +1.37%) again benefited from the weakening dollar. The XLB has carried the lowest SCTR score among sector ETFs, but its performance the past 8 trading days has been solid because of the weakening dollar and yesterday its SCTR score passed the XLP. Watch for the dollar to resume its uptrend sooner rather than later and that will likely put an end to the recent outperformance by the XLB. One group within materials did break out, however. If I invested in the materials space, it would likely be in the specialty chemicals ($DJUSCX) area, which closed at an all-time high on Monday:
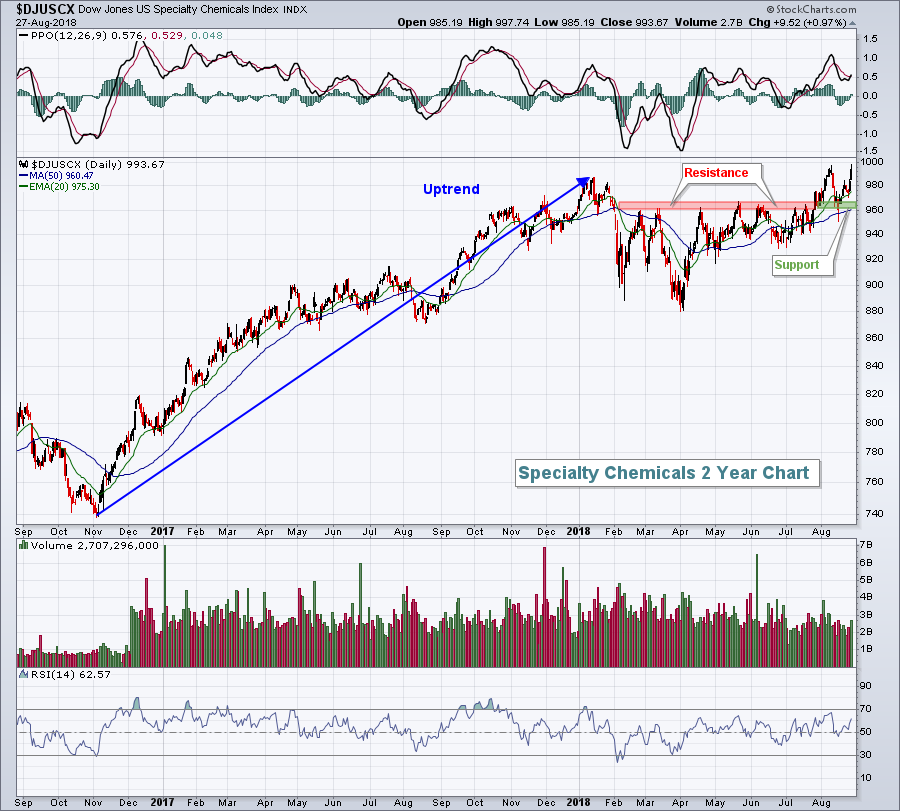 The all-time high close was barely above the earlier closing high in August so today's action will be important to see whether we confirm yesterday's breakout or if a pause is warranted. Either way, I believe this chart is quite bullish - the most bullish within the materials sector. CF Industries (CF) recently beat Wall Street consensus estimates as to both revenues and EPS, carries a SCTR rank of 96 and has been an outstanding technical performer within this area of the market.
Financials (XLF, +1.35%) were also quite strong, led by exactly the right group of industries - investment services ($DJUSSB, +1.96%), full line insurance ($DJUSIF, +1.78%), life insurance ($DJUSIL, +1.30%), asset managers ($DJUSAG, +1.21%) and banks ($DJUSBK, +1.18%). These groups tend to perform very well as our economy strengthens and they're mostly positively correlated with the direction of the 10 year treasury yield ($TNX). So it shouldn't be too big of a shock that the TNX yesterday bounced off key yield support near 2.81%. More on that TNX bounce below in the Current Outlook section.
Pre-Market Action
Global markets are mostly higher and money continues to rotate away from treasuries this morning as the 10 year treasury yield ($TNX) has climbed another 3 basis points to 2.88%. Gold ($GOLD) is up slightly as the U.S. Dollar Index ($USD) retreats. Today would mark the 8th drop in the USD in 9 days if current losses hold up.
More all-time record highs appear to be in store for the U.S. stock market as Dow Jones futures point to a 54 point gain as we approach today's opening bell.
Current Outlook
Technically, it's beginning to look to me like a resumption of the financials- and industrials-led bull market rally that we enjoyed during a couple of extended periods these past few years. We need to watch the behavior of the 10 year treasury yield ($TNX) for clues. If that yield trends higher from here, look for more and more money to rotate to financials and industrials. Here's the relationship between trending yields and the relative performance of XLF and XLI vs. the benchmark S&P 500:
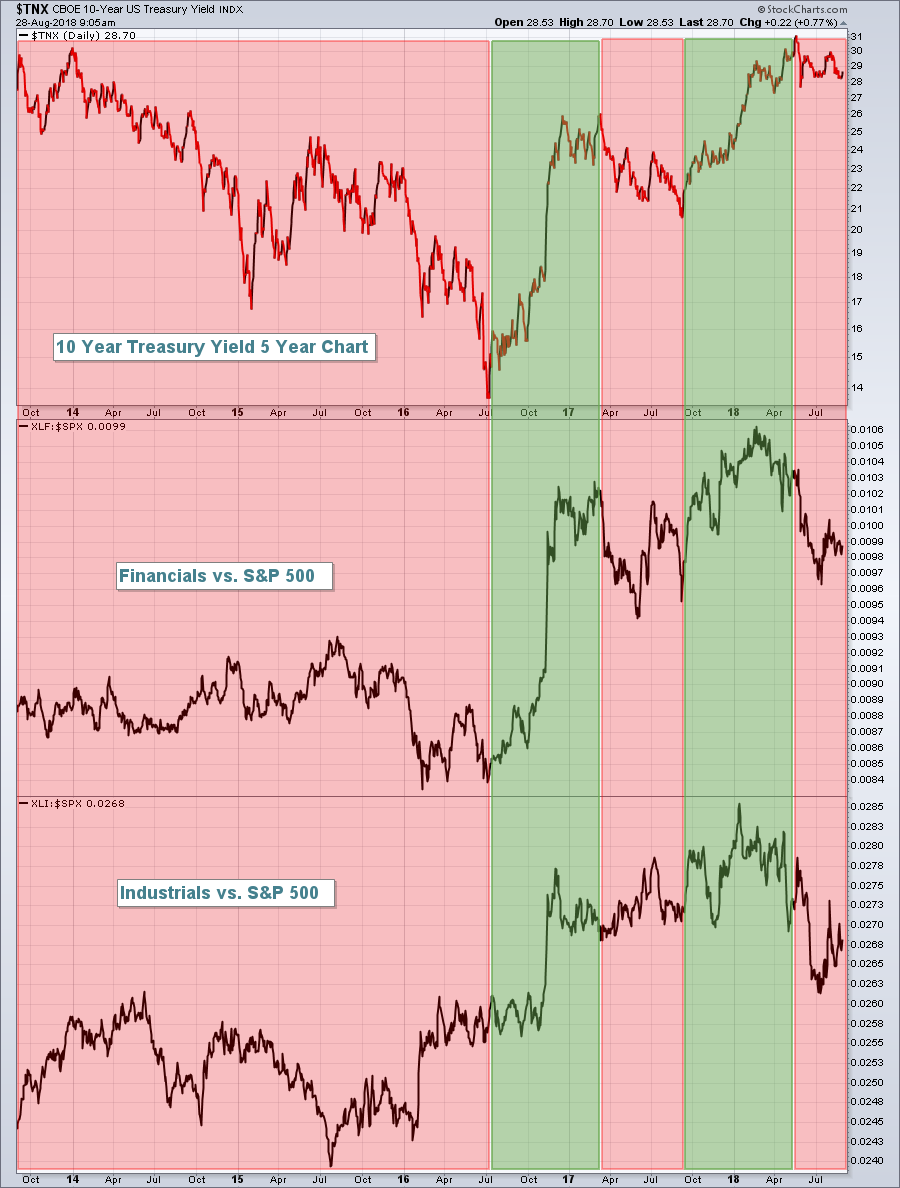 The TNX held onto yield support from early July near the 2.81% level and now appears to be turning higher. Both the XLF and XLI responded by closing at multi-month highs. If the TNX continues to trend higher, there's a very good chance we'll see outperformance by both the financial and industrials sectors. As a traders, I try to anticipate relative strength and then invest in companies in those spaces that have beaten Wall Street consensus estimates in their most recent quarterly earnings report.
Sector/Industry Watch
The Dow Jones U.S. Computer Hardware Index ($DJUSCR) has been one of the best performing groups this summer, thanks in large part to stellar performance from Apple, Inc. (AAPL). But even the strongest of the strong generally require consolidation/basing before pushing to new heights. I believe we're getting closer and closer to a significant period of selling/consolidation in the DJUSCR. Here's a chart to argue my point:
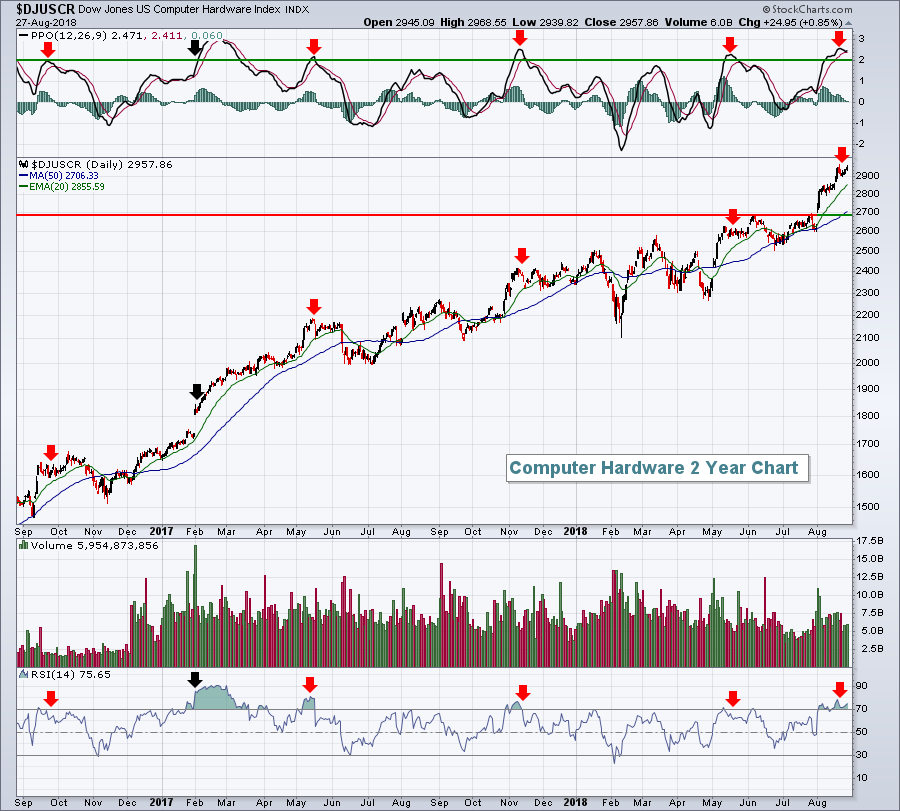 Over the past two years, the combination of a PPO above 2 and an RSI above 70 (red arrows) have suggested it was time for this index to take a rest. In each of the above cases (with the black arrows marking the one major exception in February 2017), the DJUSCR paused and even saw some rather significant selling (5%-8%) in the weeks after that PPO/RSI overbought combination. It's important to note that technical analysis NEVER provides guarantees. Instead, it should be used to manage risk. The above chart tells me there's a much higher current level of risk to invest/trade companies in the DJUSCR, particularly AAPL.
Historical Tendencies
The typical bullishness from the 26th of one calendar month through the 6th of the next calendar month doesn't apply as well to August and September. Here are the annualized returns for each of these days on the NASDAQ since 1971:
Aug 26th: +46.79%
Aug 27th: +2.42%
Aug 28th: -30.77%
Aug 29th: +64.20%
Aug 30th: -48.86%
Aug 31st: +15.33%
Sep 1st: +52.15%
Sep 2nd: +85.33%
Sep 3rd: -14.78%
Sep 4th: -54.85%
Sep 5th: -64.30%
Sep 6th: +41.11%
August 31st through September 2nd isn't bad, but several of the other days carry negative annualized returns. It's definitely a mixed historical picture this time of year.
Key Earnings Reports
(actual vs. estimate):
BBY: .91 vs .83
BMO: 1.82 vs 1.75
BNS: 1.36 vs 1.37
TIF: 1.17 vs 1.00
(reports after close, estimate provided):
HPE: .38
Key Economic Reports
July wholesale inventories released at 8:30am EST: +0.7% (actual) vs. +0.2% (estimate)
June Case Shiller home price index to be released at 9:00am EST: +0.2% (estimate)
August consumer confidence to be released at 10:00am EST: 126.8 (estimate)
Happy trading!
Tom


