Market Recap for Friday, August 24, 2018
The boring stock market months of July, August and September just got a lot more exciting. Yesterday, the benchmark S&P 500 did something it's never done before. It closed above 2873. The NASDAQ and Russell 2000 also closed at record highs on Friday, although they both had done so in recent months while the S&P 500 slowly made its way higher to test its January closing high.
Materials (XLB, +1.30%) were buoyed no doubt by a dollar ($USD) that fell for the sixth time in the past seven sessions. The dollar drop follows a steep increase in which the USD surged from just below 94 to nearly 97 in only one month. The falling dollar is now testing key price support closer to 95. The most impressive part of Friday's action was found in technology (XLK, +1.01%), where software stocks ($DJUSSW, +1.61%) led the XLK to an all-time high close. I'd say Friday represented the most impressive day of earnings season with multiple software stocks delivering exceptional quarterly results and raising guidance. Veeva Systems (VEEV, +12.42%), Autodesk (ADSK, +15.33%) and Splunk (SPLK, +14.81%) produced three of the best earnings reports of the Q2 earnings season. We didn't have to wait for these earnings reports to understand that software was a leading industry group, however. Just take one glance at the following chart:
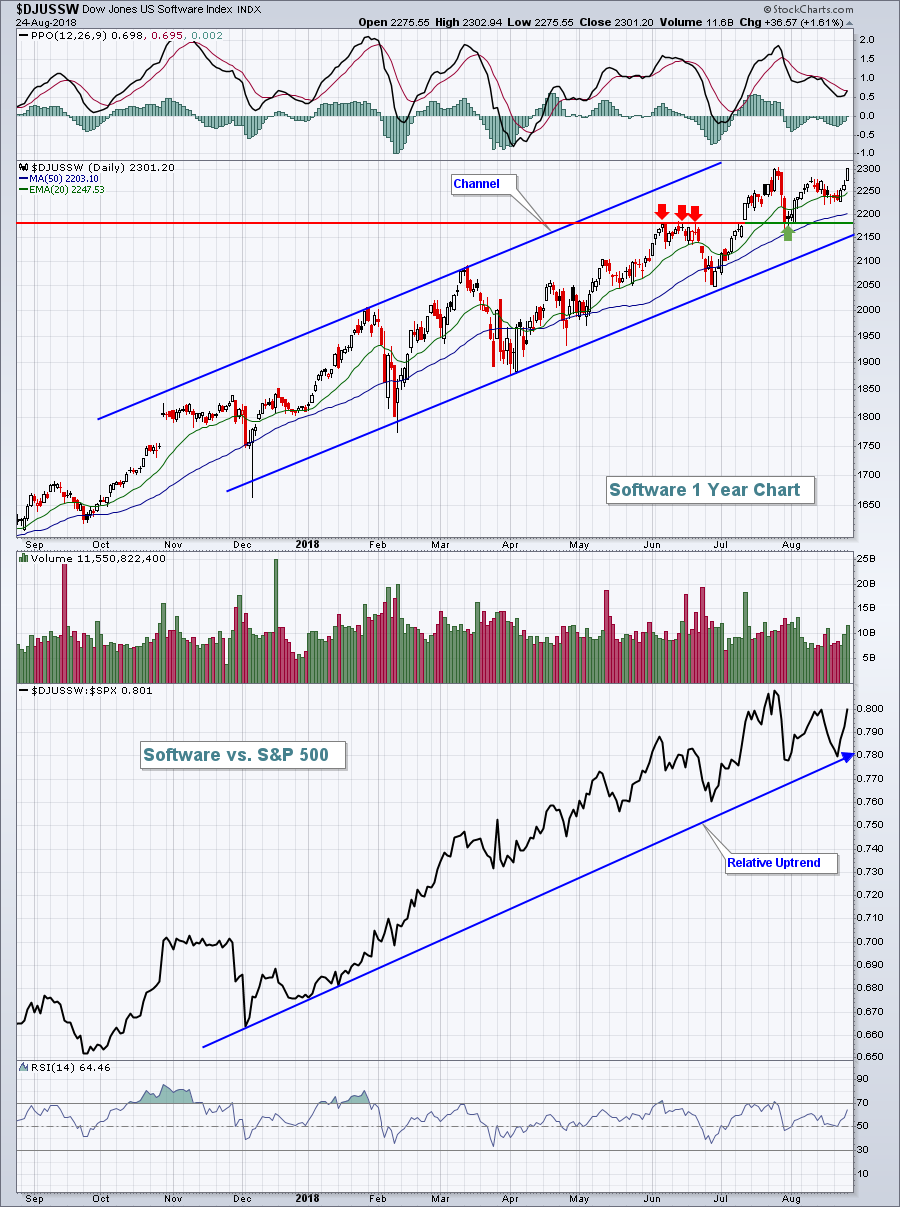 As a trader, I'm always looking to outperform the benchmark S&P 500 index. If I can't do that, then why spend all my time trading? Software has been a great area of the stock market to trade because many of its component stocks have been outperforming the S&P 500. I'm always much more attracted to areas that are benefiting from bullish rotation and currently the DJUSSW is one of those groups.
Consumer staples (XLP, -0.13%) was the only sector that failed to advance on Friday. The biggest reason for this relative weakness was Phillip Morris (PM, -3.19%), which dropped after a Jefferies analyst downgraded the stock and lowered its price target from $93 to $80. PM was trading near 82 before the downgrade. Nice call Jefferies! I have to laugh when analysts lower their price targets after a stock has already fallen. Genius.
Pre-Market Action
Global markets are strong to open a new trading week and the last week of August. The Hang Seng Index ($HSI) rallied more than 2% overnight, while China's Shanghai Composite ($SSEC) jumped nearly 2%. In Europe, we're seeing green across the board and that's all carrying over into the U.S.
Dow Jones futures are higher by 136 points with less than 30 minutes to go to the opening bell.
Current Outlook
My favorite "beneath the surface" indicator of stock market health is the ratio between consumer discretionary stocks (XLY) and consumer staples stocks (XLP). This ratio (XLY:XLP) simply tells us whether money within the consumer area is rotating more towards aggressive consumer stocks (discretionary) or safer consumer stocks (staples). Many major market tops have occurred with a bearish signal from this ratio (higher S&P 500 and lower XLY:XLP ratio). That's occurring right now:
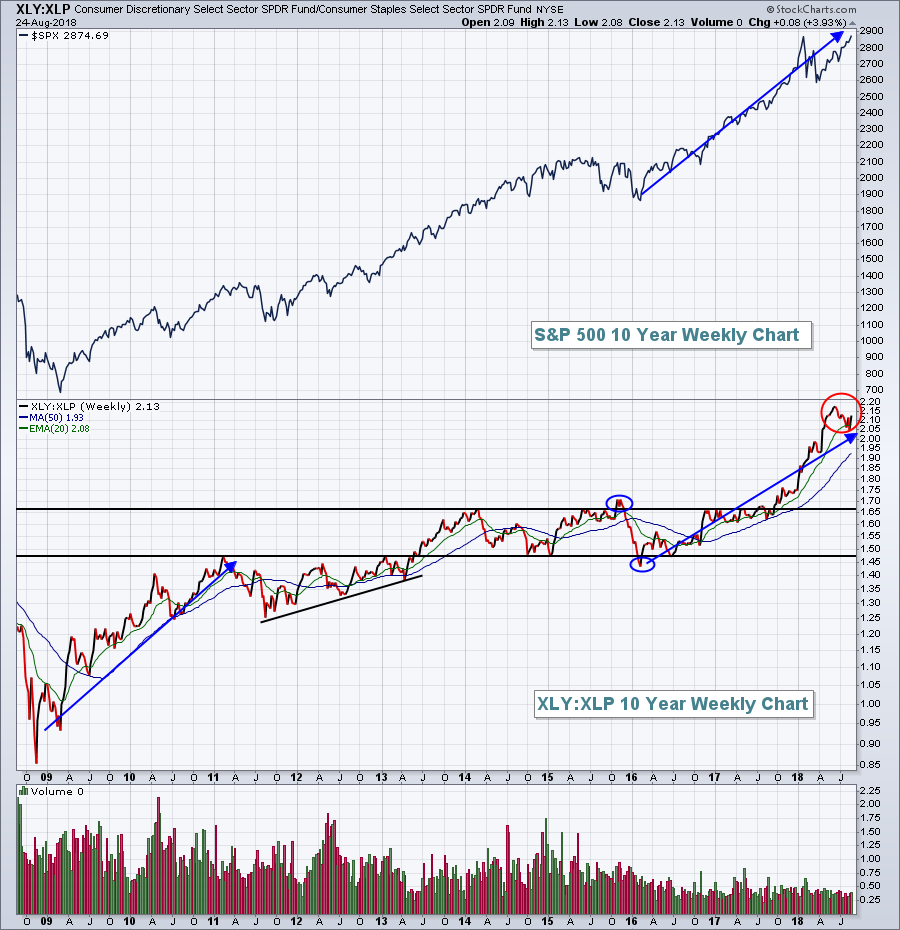 Generally speaking, the S&P 500 and the XLY:XLP ratio move in the same direction. But after stellar XLY:XLP advances, it sometimes consolidates while the S&P 500 moves higher. We saw that back in 2014 and 2015 after a huge relative rally in 2012 and 2013. Over the past year, we've seen the XLY:XLP soar again, a very bullish signal. But as the S&P 500 broke out last week, the red circle highlights the fact that the XLY:XLP is pausing and consolidating. I wouldn't be surprised to see this relative consolidation continue considering the massive prior relative advance.
Bottom line? I wouldn't use the lack of a relative breakout in the XLY:XLP as a reason to be bearish. Rallies deserve consolidation and basing, even relative rallies.
Sector/Industry Watch
Last week I highlighted the semiconductor industry ($DJUSSC) as it approached a key short-term barometer - the 20 day EMA. The DJUSSC failed to penetrate that moving average on Thursday, but that failure was quickly forgotten as technology (and semis) rallied on Friday. The Friday rally was big technically as the weekly reversal suggests we'll see more buying in semiconductor stocks this week:
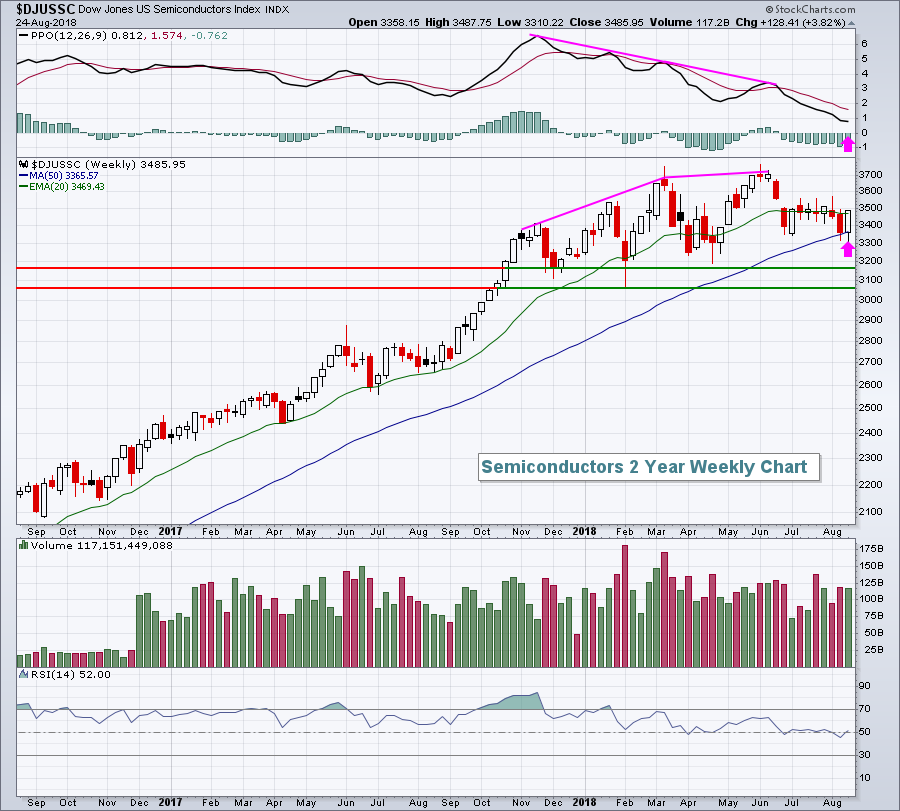 Negative divergences (higher prices, lower PPO readings) typically result in PPO centerline and 50 period SMA tests (pink arrows) that accompany consolidation or outright selling, and that's what we saw in the semiconductor space for several months. The good news is that it's resolved. The bad news is that history will be on the bears' side beginning next week. See the Historical Tendencies section below.
Monday Setups
On August 2nd, Nu Skin Enterprises (NUS) blew away Wall Street consensus estimates as to both revenues ($704.2 mil vs. $644.2 mil) and EPS ($1.08 vs. $.90) and the stock soared, jumping close to 20% on an intraday basis before cooling off. Here we are, three weeks later, and NUS has returned to the top of gap support (79.36) and its RSI has fallen from a very overbought level well into the 70s to a much more palatable 50 reading now. Check out the chart:
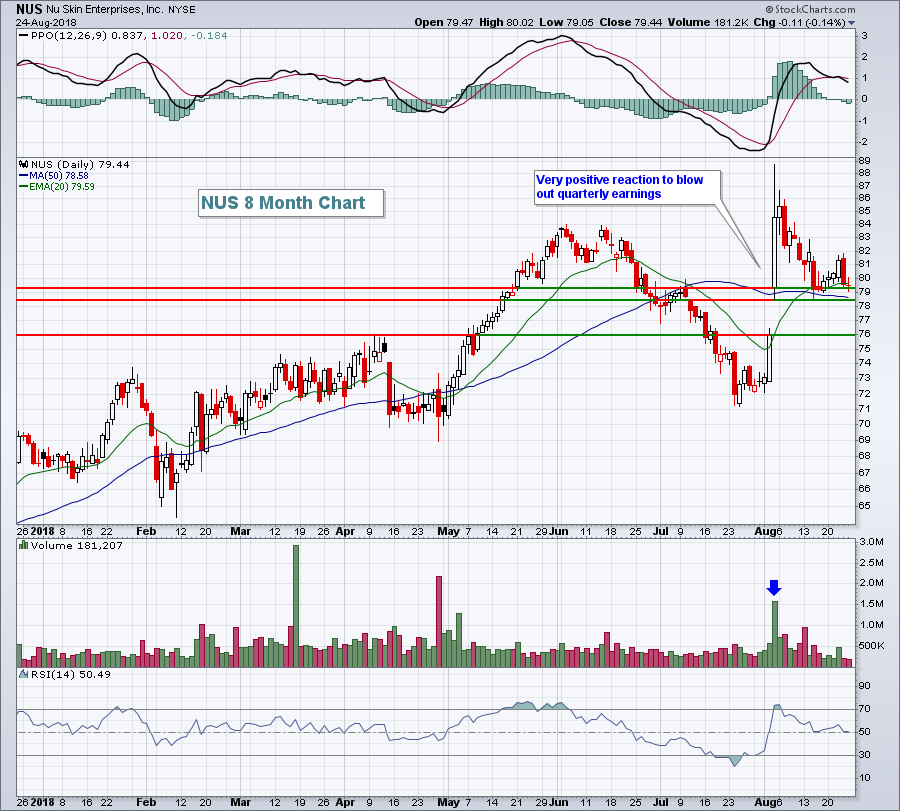 A drop below 78.25 could lead to a test of the bottom of gap support closer to 76, so consider that in any trading strategy. My closing stop would be 75.75 with an initial target in the 88.00-88.50 area.
I have several other Monday Setups that you can review by CLICKING HERE.
Historical Tendencies
The Dow Jones U.S. Semiconductors Index ($DJUSSC) was able to clear its 20 day EMA for the first time in two weeks on Friday, but this industry is far from healthy and has mixed signals. The daily chart simply reflects a group that's been consolidating for months. The weekly chart, however, is much more bullish with a reversing bullish engulfing candle at 50 week SMA support. This 50 week SMA test comes after a negative divergence had printed earlier in 2018.
Historically, the DJUSSC does not like the month of September. Over the past two decades, this index has averaged losing 4.4% during September. While that reversing candle suggests we could see additional strength this week, history tells us to be careful as we enter the notoriously bearish month of September.
Key Earnings Reports
(actual vs. estimate):
SNP: 2.82 vs 1.68
(reports after close, estimate provided):
HEI: .45
Key Economic Reports
None
Happy trading!
Tom


