Market Recap for Thursday, October 18, 2018
Impulsive selling seemed to return to Wall Street on Thursday as the Dow Jones had a couple of intraday bouts where the index declined 200-300 points in just an hour or so. That sent the Volatility Index ($VIX, +15.29%) scurrying higher once again and avoided - for the bears' benefit - a VIX drop below the 16 level. That's been a threshold support level that's held in each of the two prior bear markets. Caterpillar (CAT, -4.08%) really weighed on the Dow Jones, as did several other components that lost 2% or more (IBM, HD, AAPL, V, INTC, MSFT). Solid earnings reports thus far are generally not being rewarded as the market appears to be looking ahead and not exactly liking what it's seeing. Recent market reaction to bank earnings is one perfect example. Banks ($DJUSBK, -1.88%) were under pressure again on Thursday and should be monitored closely:
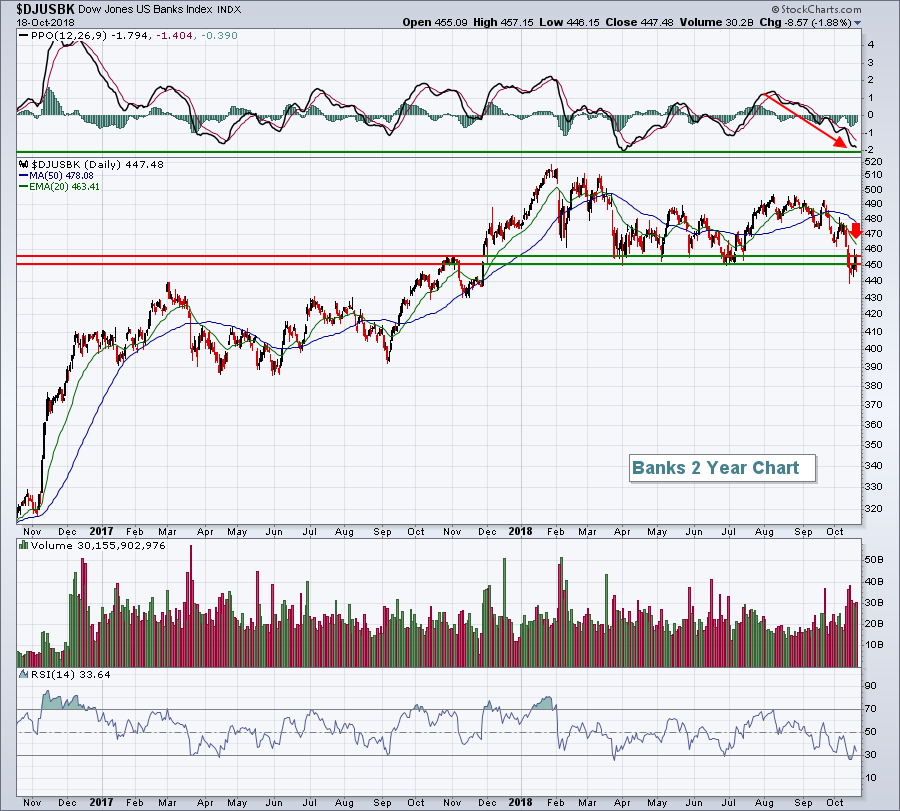 Banks tried to make a kick save after closing temporarily beneath key price support from 450-455. But the renewed selling has put the bulls on guard here. A declining bank index is not great for the 10 year old bull market as it insinuates that the health of banks is deteriorating. Our economy is dependent on available credit and banks do tend to grow more conservative if their earnings begin to deteriorate. The good news is that we haven't seen that deterioration to date as most banks have reported fairly solid results the past week or so. But a tightening yield curve is worthy to watch. If it goes negative, we could see disappointment in bank earnings in the quarters ahead and that may be what the market is suggesting with the recent price weakness.
Probably the worst news from Thursday was that selling returned in the aggressive areas of the market where we'd seen a reprieve of late. Technology (XLK, -1.96%), consumer discretionary (XLY, -1.92%) and communication services (XLC, -1.83%) were the three worst performing sectors, not great news for market bulls.
Pre-Market Action
Asian markets were mixed overnight, but China's Shanghai Composite ($SSEC) managed to post a solid 2.58% gain. Europe has not been so fortunate this morning with mixed action there. As earnings season picks up, Dow Jones futures are higher this morning by 70 points with less than 30 minutes left to the opening bell.
Current Outlook
It's difficult for me to look past the short-term warning signal yesterday when the S&P 500 moved back beneath its 20 hour EMA. We've already broken down on the daily chart with significant damage left behind, so it's not a good sign when the short-term hourly chart breaks down as it opens the door to more intermediate-term weakness. First, let's look at the hourly breakdown:
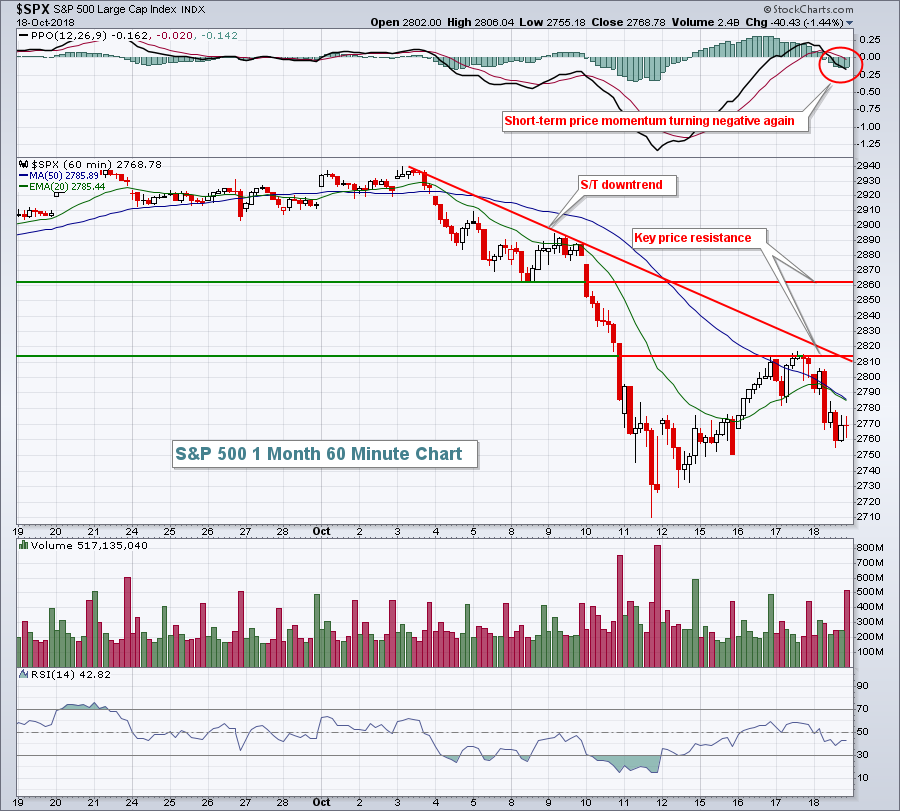 Initial price and downtrend line resistance will be felt near 2815. If we can negotiate that resistance level, then a more significant intermediate-term resistance just above 2860 could come into play. The recent low near 2710 is very important as impulsive selling could resume if that price support level is lost.
Now the S&P 500 from a more intermediate-term perspective:
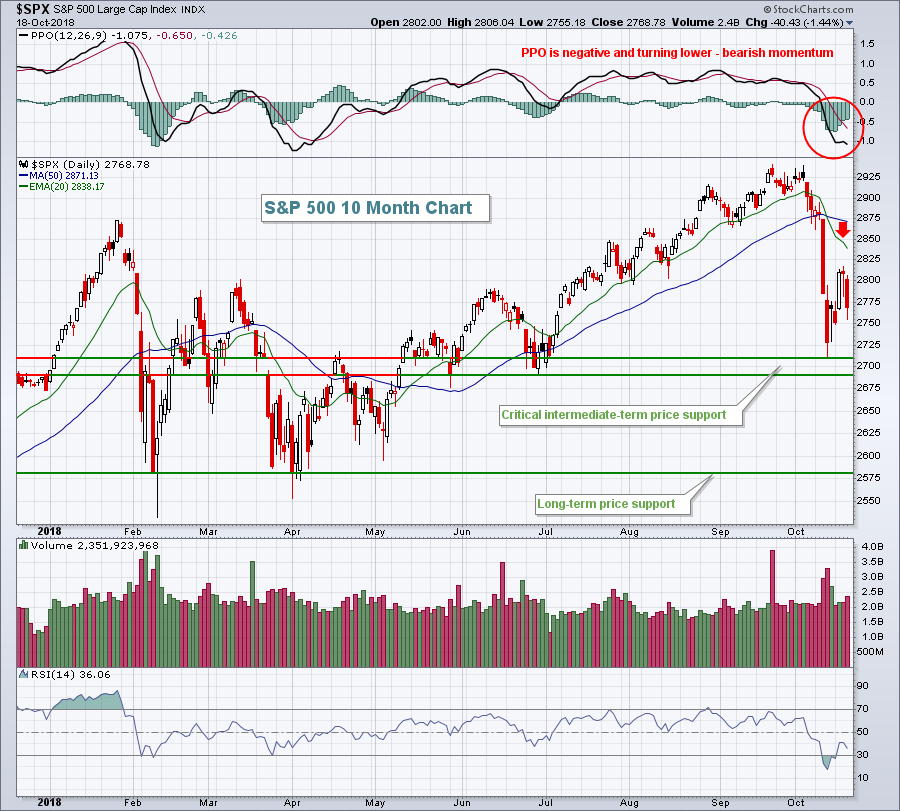 I'd feel much better about the longer-term prospects if this selling episode results in a higher low (higher than the Jan-Feb low). The best chance for that to occur will be in the 2690-2710 support zone. The red arrow marks the declining 20 day EMA and typically produces difficult closing resistance when the PPO is in negative territory and heading lower, which is exactly what we have now. A long tail beneath 2675 with a close back above 2700 might produce a significant bottom, but beware next week as it's the worst week of the year historically. More on that below in Historical Tendencies.
Sector/Industry Watch
Durable household products ($DJUSHD) has been the worst performing industry group over the past month, falling a remarkable 18.64%. Leading the charge to the downside have been Newell Brands (NWL, -22.82%), iRobot Corp (IRBT, -20.57%), Stanley Black & Decker (SWK, -20.10%) and Snap On, Inc. (SNA, -19.11%). It's been ugly. I'd steer clear of this group for the foreseeable future. Yes, they'll bounce at some point, probably to test their rapidly declining 20 day EMA, but rarely do we see a group underperform for a month like the DJUSHD has, only to become a market leader. Oh, and by the way, the DJUSHD lost its leadership role a long, long time ago:
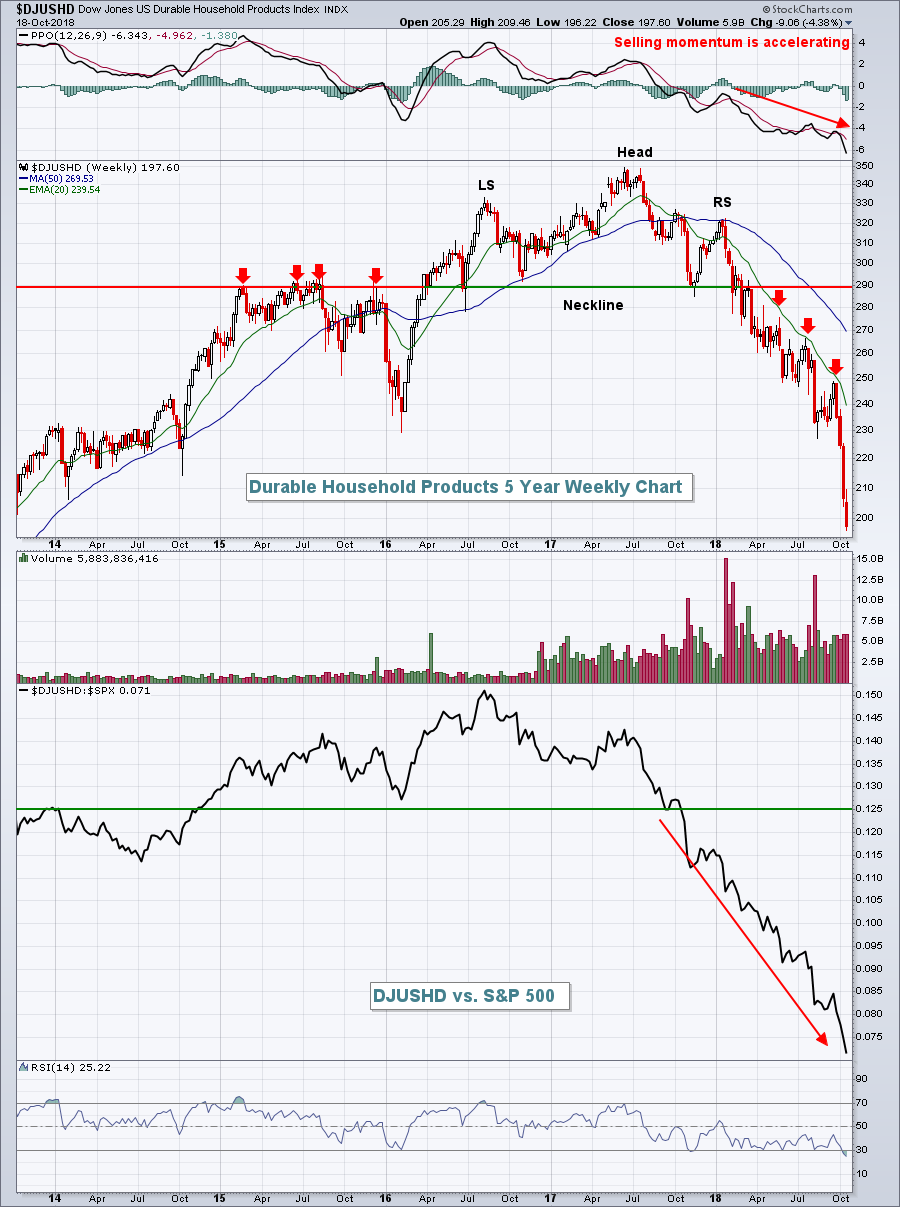 Technical analysis should not be ignored....ever. The absolute and relative price action in the DJUSHD provided multiple sell signals over the past 18 months. Always respect weekly PPOs that turn negative (cross below zero line) as they provide a very basic signal that weekly price momentum has turned negative. But the real killer here was the relative downtrend that the DJUSHD has been mired in for more than two years. If you want to outperform the S&P 500, owning stocks like NWL, IRBT, SWK and SNA, which are part of a significantly underperforming industry group, is not the way to do it.
Historical Tendencies
After today's close, we enter the most bearish historical week of the calendar year. October 22nd through 27th has produced annualized returns of -41.24% on the S&P 500 since 1950. That's a full 50 basis points below the historical average annual return on the S&P 500 of 9% over that same 68 year period.
If you think you might find historical refuge in the NASDAQ or Russell 2000, think again. Here are the annualized returns for each of these indices over the same October 22nd through 27th period:
NASDAQ (since 1971): -65.52%
Russell 2000 (since 1987): -47.00%
Key Earnings Reports
(actual vs. estimate):
CFG: .93 vs .90
HON: 2.03 vs 1.99
IPG: .48 vs .46
PG: 1.12 vs 1.09
RCI: .93 vs .88
SLB: .46 vs .45
STI: 1.42 vs 1.38
STT: 1.87 vs 1.88
SYF: .91 vs .80
VFC: 1.43 vs 1.33
Key Economic Reports
September existing home sales to be released at 10:00am EST: 5,300,000 (estimate)
Happy trading!
Tom


