Market Recap for Wednesday, October 17, 2018
There was a lot of back and forth action in our major indices on Wednesday. For instance, in the span of just 2 1/2 hours, the Dow Jones lost more than 300 points, then recovered them all, moving slightly into positive territory. After a couple hours of sideways, less volatile action, the Dow Jones began to weaken and finished lower by 92 points despite a solid last 15 minute finish that nearly cut the loss in half. Despite Tuesday's big rally and yesterday's mixed action, the bears are currently in control of the action:
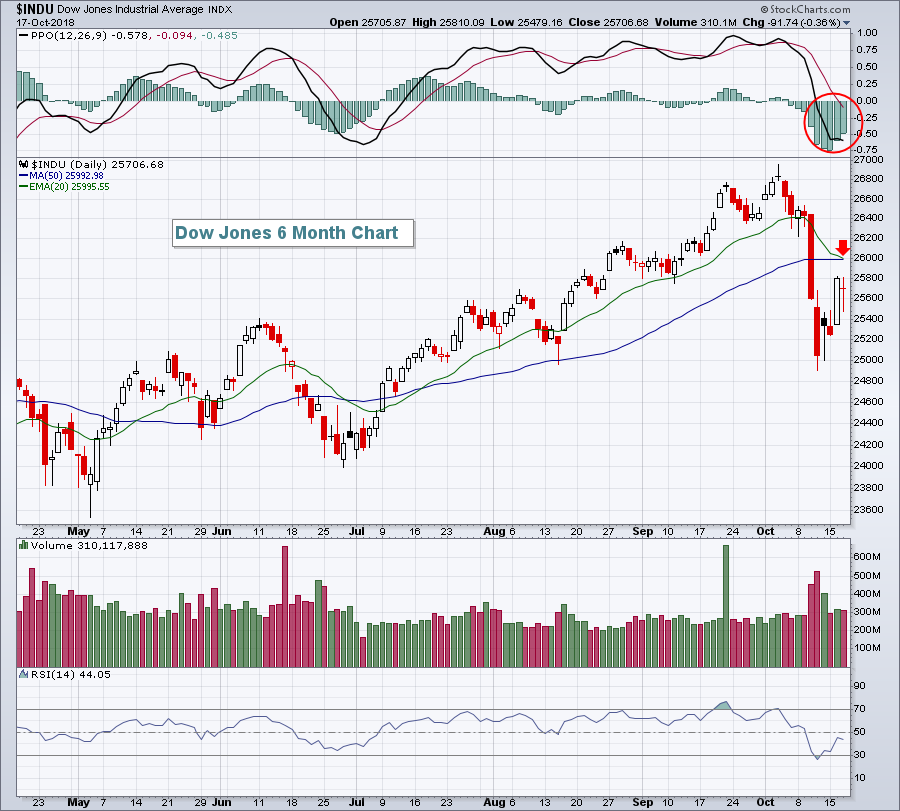 The 20 day EMA is on the verge of a bearish cross beneath the 50 day SMA, a signal that intermediate-term action is bearish. But the violent selling last week had already clued us in to that. While I'd keep a close eye on 20 day EMA resistance on further buying, I'd also watch 20 hour EMA support on the S&P 500 as perhaps a signal that panicked selling could quickly escalate:
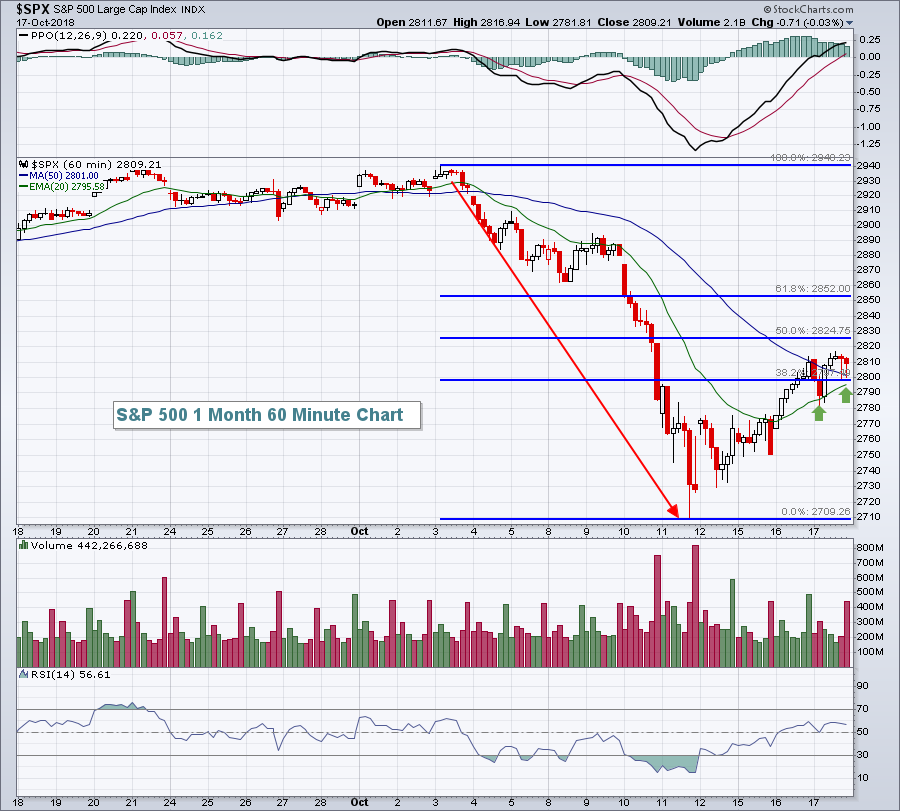 Since bottoming on the 11th, this "feel good" rally has seen a Fibonacci retracement between the key 38.2% and 50.0% levels. It certainly wouldn't be shocking to see the rally fail here and our first clue of such failure would be to end an hour back beneath the rising 20 hour EMA.
Yesterday, financials (XLF, +1.01%) led Wall Street's attempt at further gains as life insurance ($DJUSIL, +1.45%) and banks ($DJUSBK, +1.17%) rallied. Unfortunately, there's still plenty of work left to do on the XLF chart:
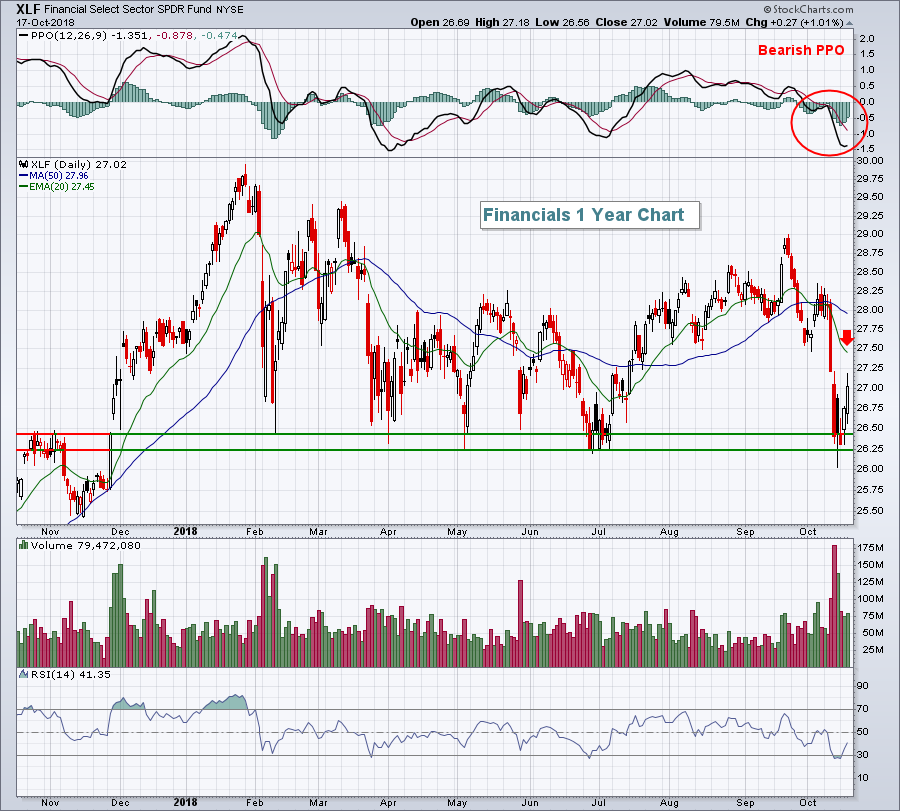 Gap and price support from 26.00-26.25 will become very important should the market lose its upward momentum and financials begin to sell off again. Watch the declining 20 day EMA here on the XLF. A break above would be a solid development. But until we see that, I'd be looking for a possible retest of last week's lows.
Pre-Market Action
The 10 year treasury yield ($TNX) has crept up above 3.20%, up a little more than 2 basis points this morning. That, combined with China's nearly 3% drop, seems to have U.S. traders a bit nervous this morning. Dow Jones futures are currently lower by 83 points with 30 minutes left to the opening bell.
Earnings season continues to ramp up with a number of large cap companies reporting their latest quarterly results. Travelers (TRV) posted what appears to be solid top and bottom lines, yet the stock is flat in pre-market action. Given the recent selling, it appears the market is looking beyond just last quarter's earnings - even those that are much better than expected.
Current Outlook
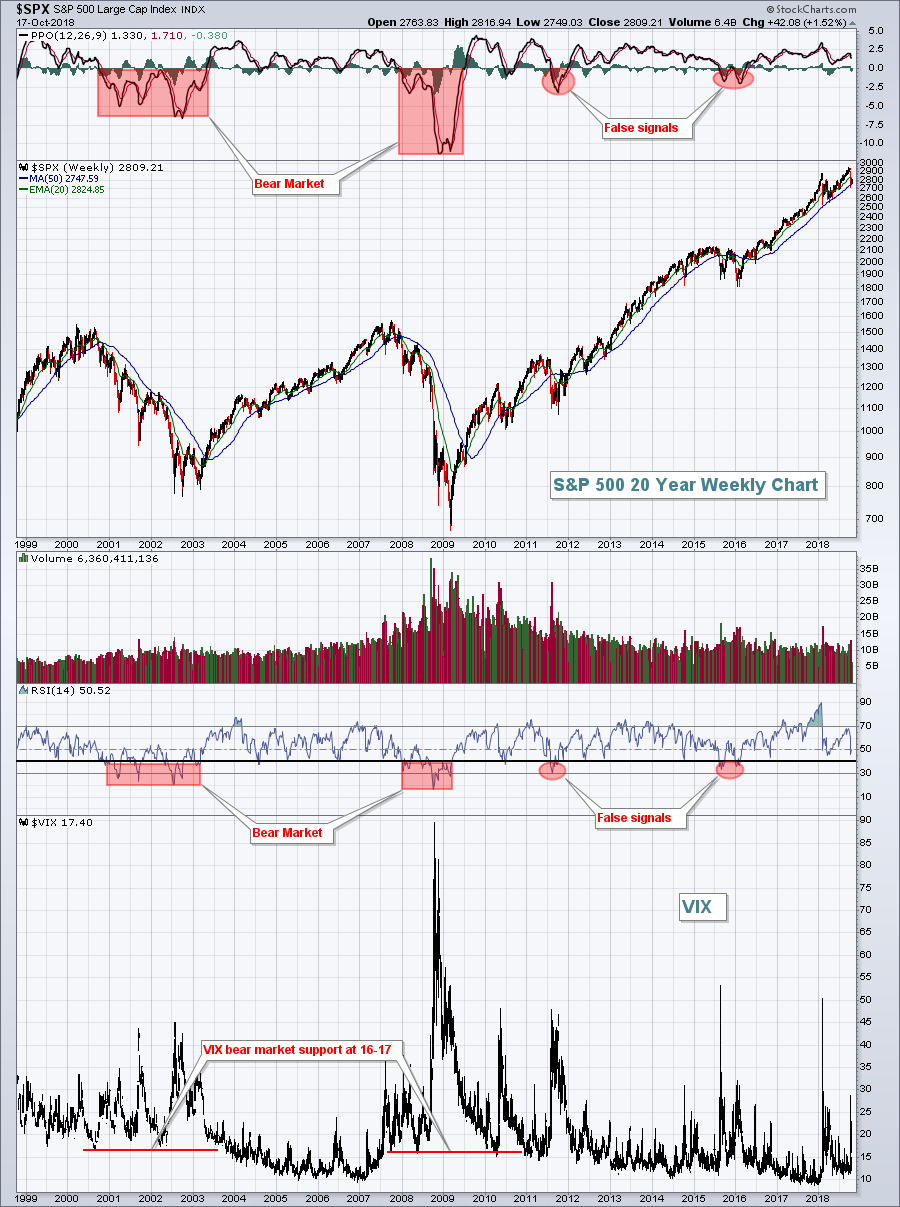
There's more talk lately about the possibility of a bear market, including our very own Arthur Hill. That makes me nervous because I have a great deal of respect for Art. Personally, I'm not concerned yet, but there are certainly a few ingredients of a bear market that are present. First, there's never been a bear market without an elevated Volatility Index ($VIX). In fact, during each of the prior two bear markets from 2000-2002 and 2007-2009, the VIX level never closed beneath 16. A bear market requires fear and the VIX is our fear gauge. Therefore, one thing I'll be watching closely is whether fear ramps up each time we hit or approach the 16-17 level. We closed yesterday at 17.40 after hitting an intraday high of 28.84 one week ago. A move in the VIX much below 16 would suggest that bull market complacency is returning and would lessen the odds that we're in or approaching a bear market. As a refresher, here is a chart of the S&P 500 over the past 20 years, highlighting the elevated VIX during the last two bear markets:
 From the above chart, you can quickly conclude a few things:
(1) A bear market will always have weekly PPO readings below zero, but not every PPO cross into negative territory triggers a bear market.
(2) A bear market will always have weekly RSI readings that dip to 30 or below, but not every RSI 30 reading triggers a bear market.
(3) A bear market will always have VIX readings above 17, but not every VIX spike above 17 triggers a bear market.
I don't believe we have enough information yet to call a bear market. In fact, weekly PPOs and RSIs do not even support a bear market yet. So while the VIX suggests that sentiment is such that a bear market could develop, I believe there's much more confirmation necessary to make that call. My intermarket analysis work doesn't support a bear market either, but I'll save that for another day.
Sector/Industry Watch
We continue to see strong absolute and relative performance from the restaurants & bars ($DJUSRU), but there's still much technical work to do:
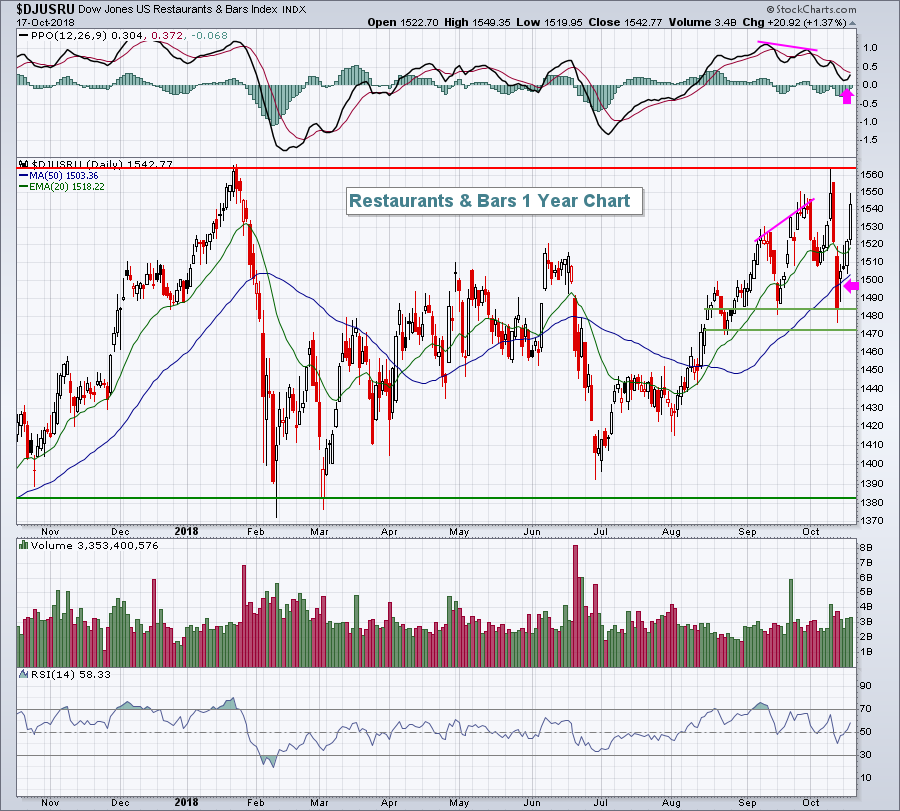 The group isn't far from a breakout, which is more than most every other industry group can say. But its last attempt was doomed as overbought conditions and a negative divergence combined to stymie the bulls. Now the PPO is bouncing off centerline support and is in a much better position to support a breakout. Keep in mind, however, that both energy (XLE) and semiconductors ($DJUSSC) were poised for breakouts, trending higher and both collapsed before a breakout ever occurred. So the bottom line here is to respect that overhead price resistance until its cleared.
Historical Tendencies
I mentioned earlier that restaurants & bars ($DJUSRU) have been performing very well of late. October and November both tend to be strong calendar months for this industry as the DJUSRU has averaged gaining 2.4% and 2.8% for those months, respectively, over the past two decades. One stock in the space, Darden Restaurants, Inc. (DRI) has averaged gaining 7.2% in Q4 alone over the past 20 years and just crossed above its 20 day EMA. Given current market conditions, I'd absolutely keep a stop in place beneath the 20 day EMA, but DRI is certainly a stock that could benefit from any strengthening conditions in the overall market.
Key Earnings Reports
(actual vs. estimate):
ADS: 6.26 vs 6.26
BBT: 1.03 vs 1.00
BK: 1.06 vs 1.04
BX: .76 vs .73
DHR: 1.10 vs 1.07
DOV: 1.36 vs 1.29
ERIC: .12 vs .04
GPC: 1.49 - estimate, awaiting results
KEY: .45 vs .44
NUE: 2.35 - estimate, awaiting results
NVS: 1.31 vs 1.31
PM: 1.44 vs 1.28
PPG: 1.45 vs 1.43
SAP: 1.33 vs 1.26
TRV: 2.54 vs 2.22
TXT: .61 vs .76
(reports after close, estimate provided):
AXP: 1.78
CE: 2.75
CP: 3.16
ETFC: .83
ISRG: 2.65
PYPL: .54
Key Economic Reports
Initial jobless claims released at 8:30am EST: 210,000 (actual) vs. 215,000 (estimate)
October Philadelphia Fed business outlook survey released at 8:30am EST: 22.2 (actual) vs. 20.0 (estimate)
September leading indicators to be released at 10:00am EST: +0.5% (estimate)
Happy trading!
Tom


