Market Recap for October 24, 2018
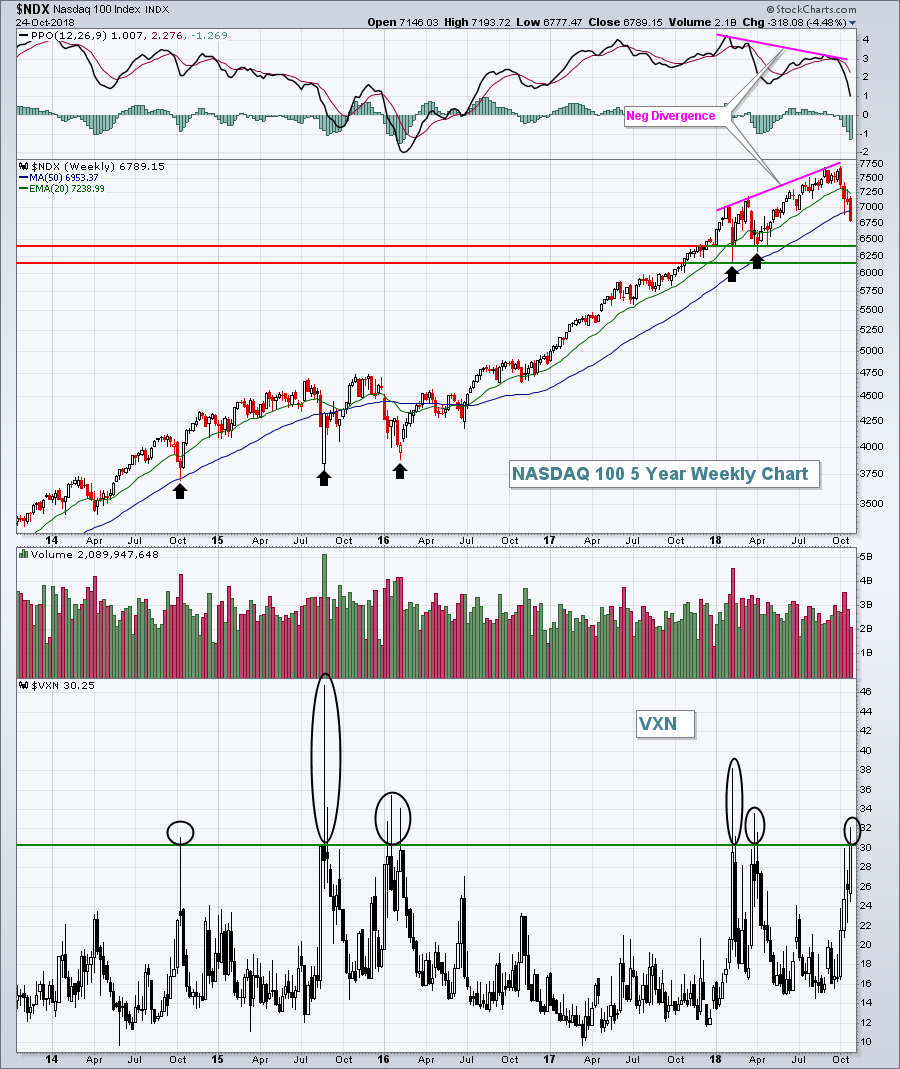
When the Volatility Index ($VIX, +21.83%) is elevated, like it's been throughout much of October, it should be no shock when Wall Street has a day like it did yesterday. There was a buyers strike and the Dow Jones lost 500 points in just the last 90 minutes of Wednesday's session. A 100 point loss quickly became a 600 point loss. But the Dow's 2.41% drop paled in comparison to the NASDAQ's and Russell 2000's losses of 4.43% and 3.79%, respectively. It generally takes weeks to see those types of gains, yet major damage was inflicted to the downside in hours. The NASDAQ 100's Volatility Index ($VXN) closed above 30 and suggests we're nearing a panicked, heavy volume capitulation that will likely mark a very significant bottom. Check this out:
 Right now, the U.S. stock market is trading off of fear. Not technical conditions. Not fundamental information. It's pure panic. The good news is that a surging VIX and VXN mark important bottoms across our major indices. The problem or risk is that if your timing is off by a day or two in calling a bottom, you could be down 5% or more. Volatility surged back in February 2018 and I called a bottom two days early ("I'll Step Out On That Limb, The Bottom Is In"). The idea was correct, but 2 days can be an eternity when the stock market is selling off without a floor in sight.
Major rotation into defensive stocks took place yesterday. Utilities (XLU, +2.43%), real estate (XLRE, +1.17%) and consumer staples (XLP, +0.42%) represent defensive sectors and all were higher yesterday. But their strength wasn't nearly enough to offset the heavy losses in aggressive areas. Communication services (XLC, -4.76%) and technology (XLK, -4.48%)
Pre-Market Action
Overnight the Tokyo Nikkei ($NIKK) tumbled more than 3.72% to a multi-month closing low. The NIKK had been a pillar of strength in Asia so seeing a big loss in terms of both price and price support is not good news for other parts of the world. The German DAX ($DAX), after a very rough 10% drop in October, is bouncing slightly this morning - not a great sign for a big U.S. rally.
Dow Jones futures are currently higher by 103 points as we get set for today's open.
Current Outlook
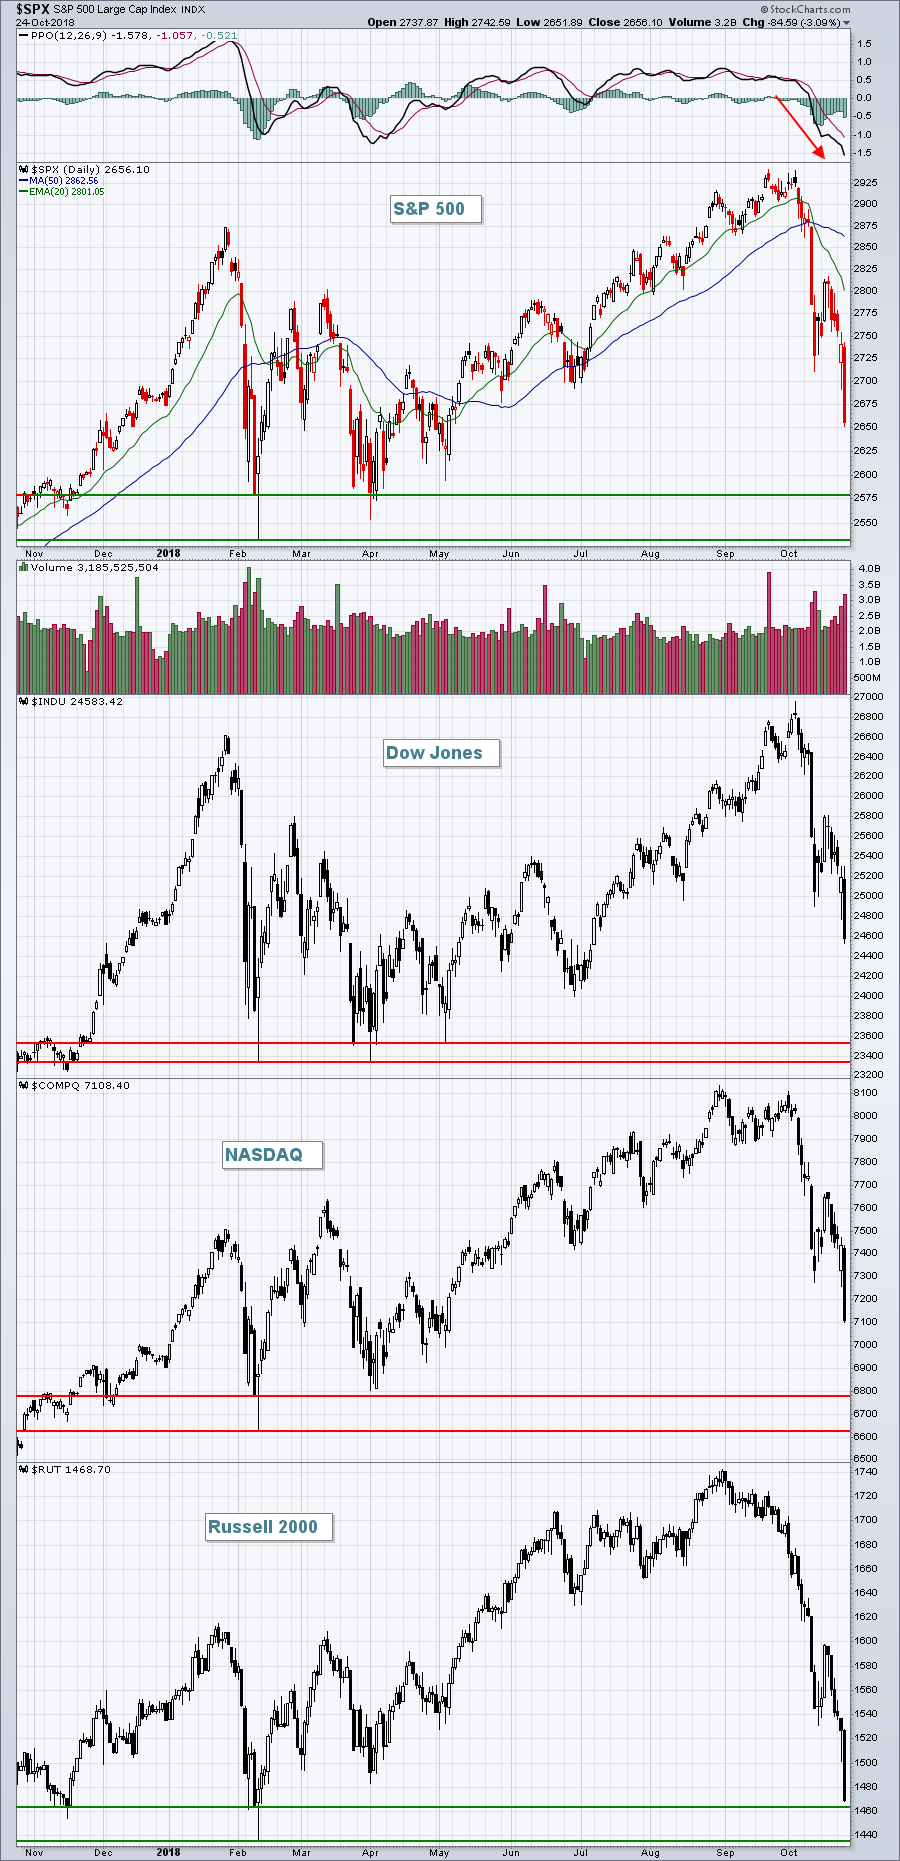
It's very difficult to provide an outlook for a stock market driven by fear. Rational short-term price support levels are routinely ignored. At this point, we should all simply be aware of the major price support levels on our major indices. So, in my opinion, here they are:
 Those February 2018 lows and subsequent retests (on a couple of the indices) are very important bull market lows. The Russell 2000 nearly reached that level yesterday, while the other indices have much further room to the downside before key tests. The higher line of support shown represents closing support while the lower support line represents intraday support.
Sector/Industry Watch
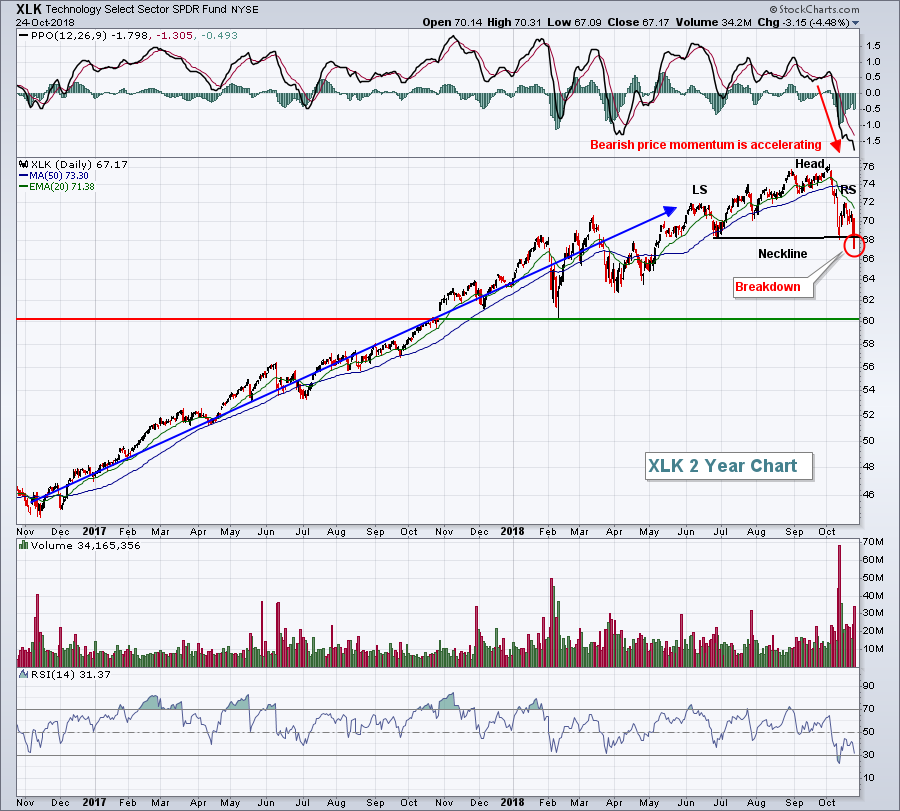
Yesterday, I pointed out the key price support on the technology ETF (XLK) near 68. That level broke yesterday and here is the implication:
 A breakdown of a topping head & shoulders pattern carries a measurement that's determined from the top of the head (76) down to the neckline (68), or 8 points. That suggests a target of 60 by subtracting 8 points from the neckline breakdown near 68. 60 also coincides with a very significant bottom established in February. That is MAJOR price support. Ultimately, we could see the XLK trading back down to that level.
Historical Tendencies
October 27th has historically been the day where many stock market bottoms have formed. Bullish historical performance after that date is rather astounding. Let's take the Russell 2000 as an example. Since 1987, the October 28th through November 6th period has produced an annualized return of +76.50%. Here are the annualized returns by calendar day:
October 28th: +195.82%
October 29th: +70.84%
October 30th: +0.87%
October 31st: +169.49%
November 1st: -80.73%
November 2nd: +144.58%
November 3rd: +124.59%
November 4th: +48.78%
November 5th: +25.76%
November 6th: +51.12%
These numbers are not being shared to try to guarantee that a bottom is forming. The stock market can do whatever it wants to do. The purpose here is simply to educate. The historical tendency is for significant stock market gains beginning on October 28th.
One final note. Historically, there is no better intermediate-term period throughout the calendar year than October 28th through January 19th. We enter that period on Monday.
Key Earnings Reports
(actual vs. estimate):
ABB: .34 vs .38
ABEV: .05 vs .05
AEP: 1.25 vs 1.23
BMY: 1.09 vs .91
BUD: .82 vs .86
CAJ: .38 vs .45
CELG: 2.29 vs 2.24
CMCSA: .65 vs .61
CME: 1.45 vs 1.42
COP: 1.36 vs 1.17
EQNR: .60 vs .55
HSY: 1.55 vs 1.56
IP: 1.56 vs 1.47
LUV: 1.08 vs 1.06
MCK: 3.60 vs 3.28
MMC: .78 vs .75
MO: 1.08 vs 1.07
MRK: 1.19 vs 1.16
NEM: .33 vs .22
NOK: .07 vs .06
RCL: 3.98 vs 3.96
RTN: 2.25 vs 1.94
SHW: 5.68 vs 5.71
SPG: 3.05 vs 3.02
SPGI: 2.11 vs 2.01
SWK: 2.08 vs 2.02
TROW: 2.30 vs 1.93
TWTR: .21 vs .14
UNP: 2.15 vs 2.09
VLO: 2.01 vs 1.95
WM: 1.15 vs 1.10
XEL: .96 vs .98
(reports after close, estimate provided):
AMZN: 3.29
BMRN: .13
CERN: .63
CMG: 2.00
DFS: 2.05
DLR: 1.62
EXPE: 3.17
FE: .73
FTV: .88
GILD: 1.66
GOOGL: 10.54
INTC: 1.15
RSG: .81
SYK: 1.68
VRSN: 1.19
Key Economic Reports
Initial jobless claims released at 8:30am EST: 215,000 (actual) vs. 212,000 (estimate)
September durable goods orders released at 8:30am EST: +0.8% (actual) vs. -1.5% (estimate)
September durable goods orders ex-transports released at 8:30am EST: +0.1% (actual) vs. +0.4% (estimate)
September pending home sales to be released at 10:00am EST: +0.0% (estimate)
Happy trading!
Tom


