Market Recap For October 23, 2018
It was a crazy day on Wall Street which, quite honestly, we should expect with a Volatility Index ($VIX) in the 20s. Jitters in global markets saw U.S. futures plunge yesterday morning. Our major indices opened more than 2% lower and it appeared we could be in for "one of those days." But buyers stepped up to the plate and our major indices cut into those losses throughout the session. The NASDAQ briefly went green after being down close to 200 points in the first half hour of trading. That is quite the reversal. Unfortunately, it wasn't able to keep the rally going and clear short-term trendline resistance. Check out the intraday chart below:
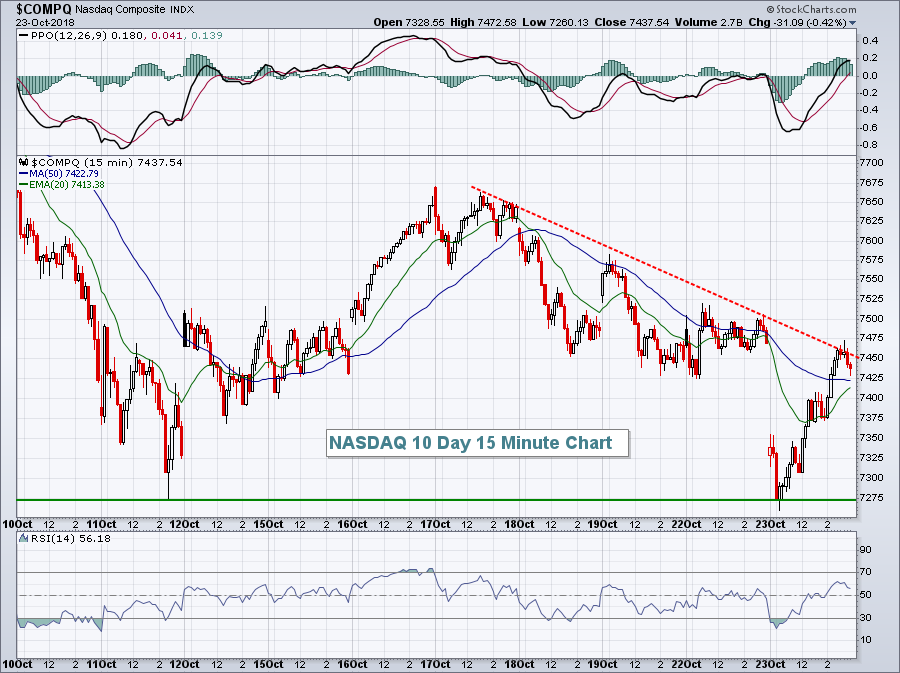 While there was an opportunity to daytrade the NASDAQ's move off price support established on October 11th, I don't believe the strength was due to anything other than short-term market maker manipulation. Everyone was selling on the panicked gap lower at the open, which means market makers were primarily responsible for the buying throughout much of the session. The NASDAQ dropped nearly 50 points in the final half hour of trading as many earlier long positions were likely closed out. Today, we see futures relatively flat on the NASDAQ. I'm guessing we'll see sellers return and that downtrend on the chart above hold.
One problem with a 500 point reversal on the Dow Jones is a sector leaderboard that shows the top two sectors were real estate (XLRE, +0.64%) and consumer staples (XLP, +0.44%) - both defensive sectors. We're in a risk-off environment right now and that will make rallies difficult to sustain....until that defensive mentality changes.
Pre-Market Action
As you can see from the list of Key Earnings Reports below, the number of companies reporting their latest quarterly results is growing exponentially. Wall Street has no doubt been quite fearful the past few weeks, but solid earnings and confident forecasts could be a catalyst for higher prices ahead. Obviously, the opposite holds true as well. Disappointing results and/or weak forecasts could accelerate the selling.
Asian markets were mixed overnight, while European markets are mostly higher this morning. But the German DAX has broken down, as highlighted below in the Current Outlook section. Dow Jones futures popped earlier this morning on Boeing's (BA) strong quarterly earnings results, but have been trending lower since. Currently, Dow Jones futures are 23 points as we approach today's opening bell.
Current Outlook
One problem that U.S. stocks face is the positive correlation that the S&P 500 ($SPX) and German DAX ($DAX) have historically shown. Recently, we've seen the SPX make new all-time highs while the DAX has struggled and just confirmed a topping head & shoulders pattern:
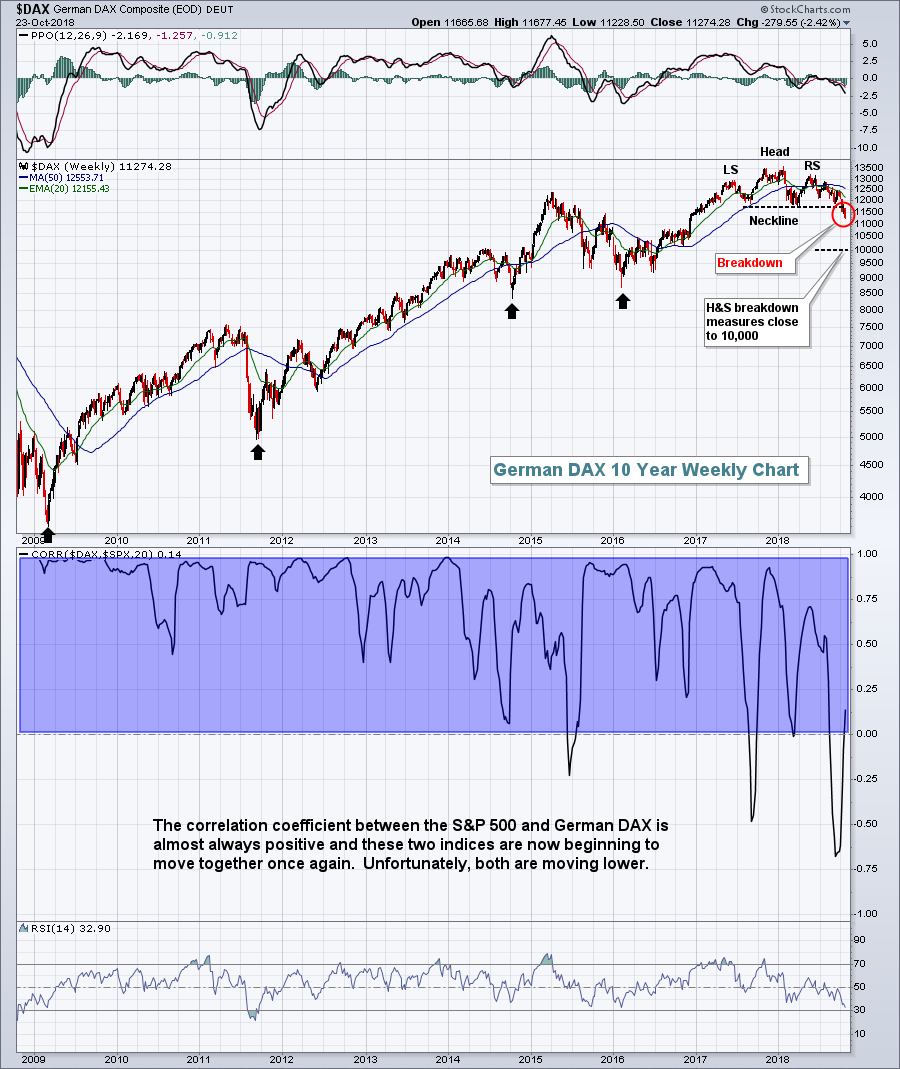 Something has to give here. Either the DAX needs to climb back above neckline resistance and right the ship OR the S&P 500 has much further downside possible. From yesterday's close, the DAX has another 10% downside left to reach its measurement to roughly 10000. If that occurs, it's hard to imagine the SPX ignoring such a move and rallying. This is a chart that supports the notion that the S&P 500 has begun a deeper decline. The February 2018 low just above 2500 is certainly a possible target for the SPX based simply on the chart above and the historical positive correlation between the SPX and DAX.
Sector/Industry Watch
We need to keep a very close eye on the Technology Select Sector SPDR Fund (XLK, -0.38%). Yesterday, this highly influential sector tested a key multi-month low and bounced. A breakdown beneath this support level would be bad news technically. For those who believe the stock market goes higher and wants to participate, trading the XLK on the long side at or near this support level, with a tight stop, makes some sense:
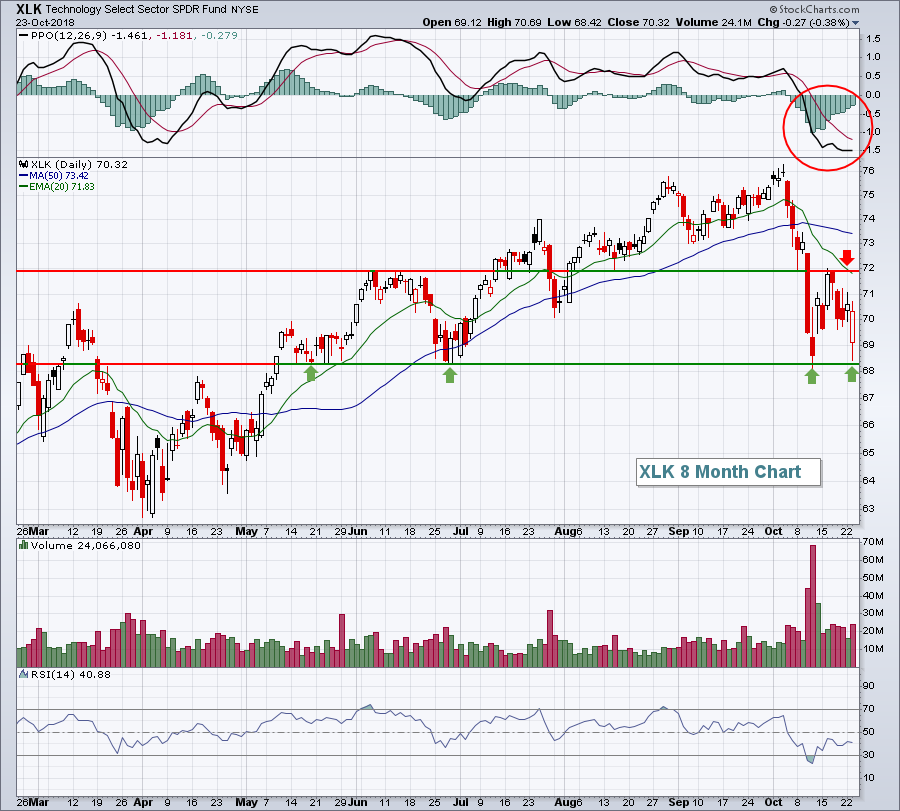 Here's the problem with trading it at its current level, however. The red circle highlights that PPO is negative (below zero line) and moving lower, suggesting an acceleration of selling momentum. The very heavy volume is also a signal of distribution. So to the upside, I would be looking only for a 20 day EMA test, which coincides with the most recent price high. From Tuesday's close of 70.32, that leaves short-term upside of just above 2%. To the downside, a stop of say 68.00 would mean your risk would be more than 3%. That reward to risk doesn't justify a trade. Therefore, I'll continue to sit on my hands and watch this volatile period play out.
Historical Tendencies
Over the past three decades, the calendar months from November through May have all (except January) produced double digit annualized returns on the small cap Russell 2000 ($RUT). Here are the annualized returns by month:
November: +14.39%
December: +34.08%
January: +7.13%
February: +15.64%
March: +17.21%
April: +14.04%
May: +14.36%
Key Earnings Reports
(actual vs. estimate):
ABX: .06 (estimate, awaiting results)
ALXN: 2.02 vs 1.75
APH: .99 vs .94
BA: 3.58 vs 3.45
BSX: .35 vs .34
CHKP: 1.38 vs 1.36
DASTY: .83 vs .78
DTE: 2.13 vs 1.74 (not sure if numbers are comparable)
GD: 2.85 vs 2.74
HLT: .77 vs .75
IR: 1.75 vs 1.72
ITW: 1.90 vs 1.89
LH: 2.74 vs 2.87
NOC: 6.54 vs 4.35
NSC: 2.52 vs 2.44
QSR: .63 vs .65
ROL: .31 vs .30
SIRI: .07 vs .06
STM: .41 vs .37
T: .90 vs .93
TMO: 2.62 vs 2.55
UPMKY: .71 vs .77
UPS: 1.82 vs 1.82
(reports after close, estimate provided):
AFL: .99
ALGN: 1.19
AMD: .13
CTXS: 1.25
EFX: 1.42
F: .29
FCX: .33
FFIV: 2.63
FTI: .38
LVS: .84
MKL: 8.99
MSFT: .96
NOW: .60
ORLY: 4.30
RJF: 1.81
TSLA: (.53)
V: 1.20
VRTX: 1.00
XLNX: .75
Key Economic Reports
August FHFA house price index to be released at 9:00am EST: +0.3% (estimate)
October PMI composite flash to be released at 9:45am EST: 54.1 (estimate)
September new home sales to be released at 10:00am EST: 625,000 (estimate)
Happy trading!
Tom


