Market Recap for Friday, September 28, 2018
Friday saw very choppy action to close out the 3rd quarter. The good news is that Q3 typically represents the U.S. market's weakest quarter in terms of performance. However, this year saw significant gains over the summer months as the S&P 500 opened the quarter at 2718 and closed it at 2914, representing a nearly 200 point gain - one of the best Q3s on record. The NASDAQ opened the quarter at 7510 and gained more than 500 points. Healthcare (XLV, +14.68%) and industrials (XLI, +10.21%) both gained more than 10% during the quarter. Apple, Inc. (AAPL) led computer hardware ($DJUSCR, +18.79%) to the top of the industry leaderboard. It's noteworthy that both airlines ($DJUSAR, +17.63%) and railroads ($DJUSRR, +16.35%) were quite strong as well. An outperforming transportation group ($TRAN) is generally a very good signal of economic strength ahead.
On Friday, however, it was all about utilities (XLU, +1.46%) and real estate (XLRE, +1.24%) as the 10 year treasury yield ($TNX) continued to drop after its failed attempt to clear 3.11% yield resistance. As you might expect, this same issue created selling in financial shares (XLF, -1.04%). Specialty finance ($DJUSSP, -3.09%) was particularly weak and is quickly approaching key price support:
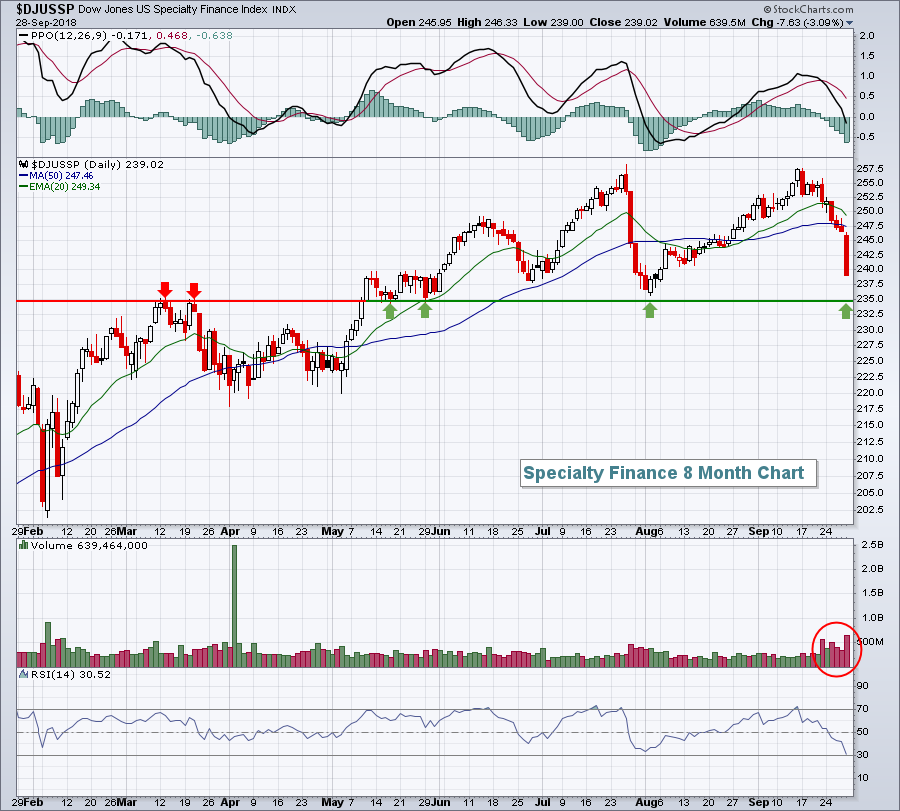 Volume has picked up in the group so that key price support level near 235 will be critical.
Pre-Market Action
U.S. futures are significantly higher this morning after the U.S., Canada and Mexico agreed to replace the North American Free Trade Agreement (NAFTA). Dow Jones futures are higher by 170 points with roughly 30 minutes until the opening bell. The strong futures suggest U.S. equity markets could be in record high territory during the session so the close will be important.
Asian markets were mixed overnight, with two key markets - China's Shanghai ($SSEC) and Hong Kong's Hang Seng Index ($HSI) - closed. Europe was solidly higher on the U.S.-Canada-Mexico trade deal.
Current Outlook
I've featured the Dow Jones U.S. Semiconductors Index ($DJUSSC) on many occasions. Nearly a month ago, I provided a chart showing that the DJUSSC had been trading in sideways fashion. That consolidation zone remains in effect today as you can see below:
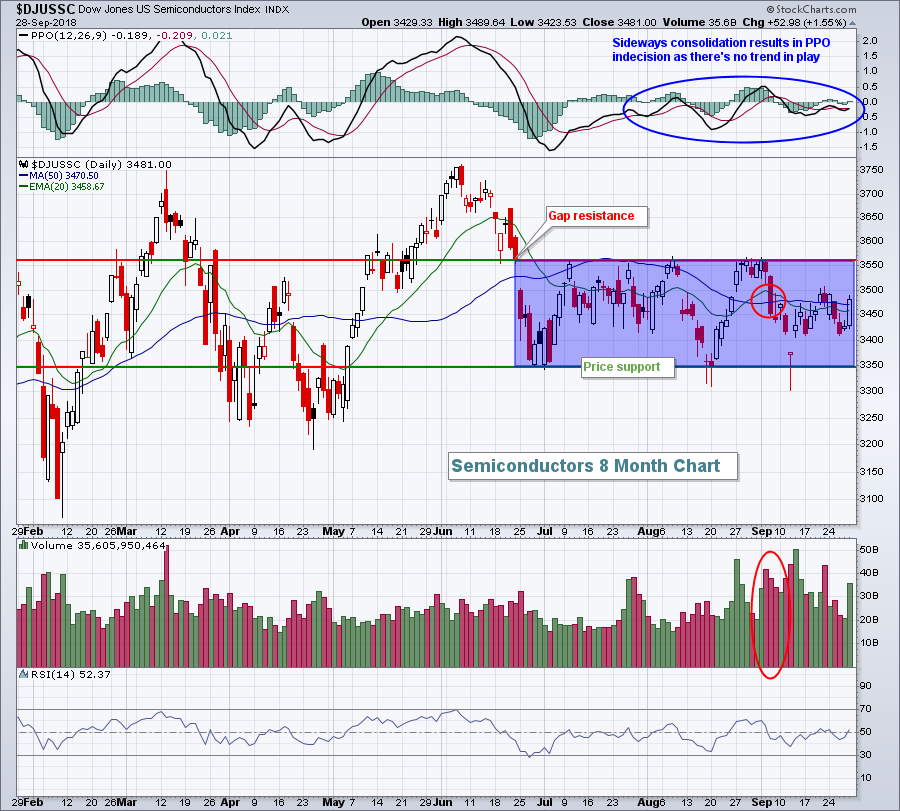 Seasonally, October is the best month of the year for the DJUSSC. Over the past two decades, the group has averaged gaining 4.2%. That's the equivalent of roughly 150 points on this index. Because we're in a bull market, I'm willing to give the DJUSSC the benefit of the doubt here and anticipate an upside breakout to its current range.
Sector/Industry Watch
Early last week, with the 10 year treasury yield ($TNX) trying to break to a 7 year high above 3.11%, both utilities (XLU) and real estate (XLRE) broke down in the short-term, closing beneath their respective 20 day EMA and 50 day SMA with a PPO that crossed below its centerline. Not good technical action. Here's the chart on the XLRE and what we might expect near-term:
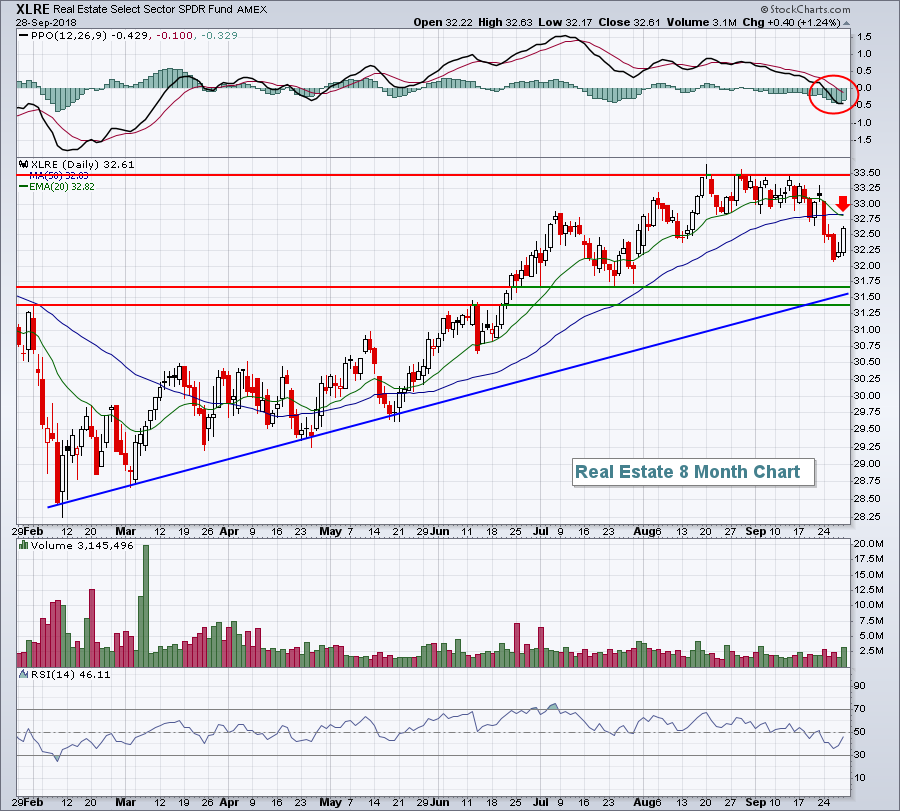 Bull market typically reward every sector. It's simply a question of relative outperformance and underperformance. Currently, I'd expect to see relative underperformance in the XLRE as the group has broken down in the short-term. There'll likely be a short-term test of resistance in the 32.75-32.85 area with a key support zone from 31.35-31.70.
Monday Setups
Synopsys, Inc. (SNPS) waltzed past its quarterly estimates on August 22nd, posting revenues of $779.7 million vs. $774.6 million and EPS of $.95 vs. $.92. The stock market reacted by sending SNPS shares 10% higher over the next three days on very heavy volume. But SNPS became very overbought in the short-term with its RSI moving into the mid-80s, never a good level to enter a stock - at least not if you're trying to manage downside risk. But here we are, a month later, and SNPS has slowly fallen back and is now back at the top of gap support with an RSI reading of 47. There's a bit more downside risk to roughly 96.50, in my opinion, but I really like the reward to risk here. I'd consider an initial entry at current price, a possible second entry at 97, a closing stop loss beneath 96 and an initial price target of 103:
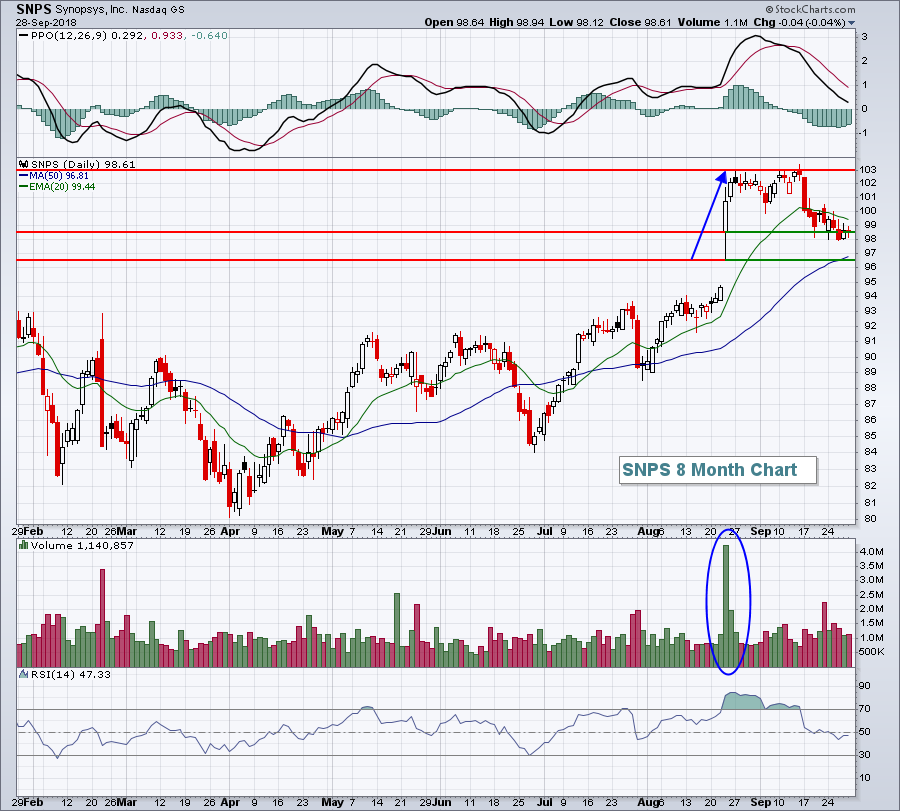 The bottom of gap support is just below 95. Those who are looking for a complete gap fill could wait to see if SNPS manages to fall that far. I don't think it will, which is why I'd look to enter higher. Another alternative is to wait to see if SNPS prints a long tail to the downside with a sharp reversal one day. That would likely mark a significant bottom.
For all of my Monday Setups for this week and to view those from the past few weeks, CLICK HERE.
Historical Tendencies
Today is October 1st and the 1st day of all calendar months has historically been our best. Since 1950 on the S&P 500, the 1st calendar day of the month has risen 320 times and fallen 200 times, which represents a 61.54% chance of moving higher. It's the highest percentage of any calendar day and compares quite favorably to the 53.38% chance throughout the calendar month. These days have produced annualized returns of +46.41%, which is more than 10 percentage points higher than any other calendar day of the month.
Key Earnings Reports
(reports after close, estimate provided):
SFIX: .04
Key Economic Reports
September PMI manufacturing index to be released at 9:45am EST: 54.5 (estimate)
September ISM manufacturing index to be released at 10:00am EST: 59.9 (estimate)
August construction spending to be released at 10:00am EST: +0.5% (estimate)
Happy trading!
Tom


