Market Recap for Thursday, September 27, 2018
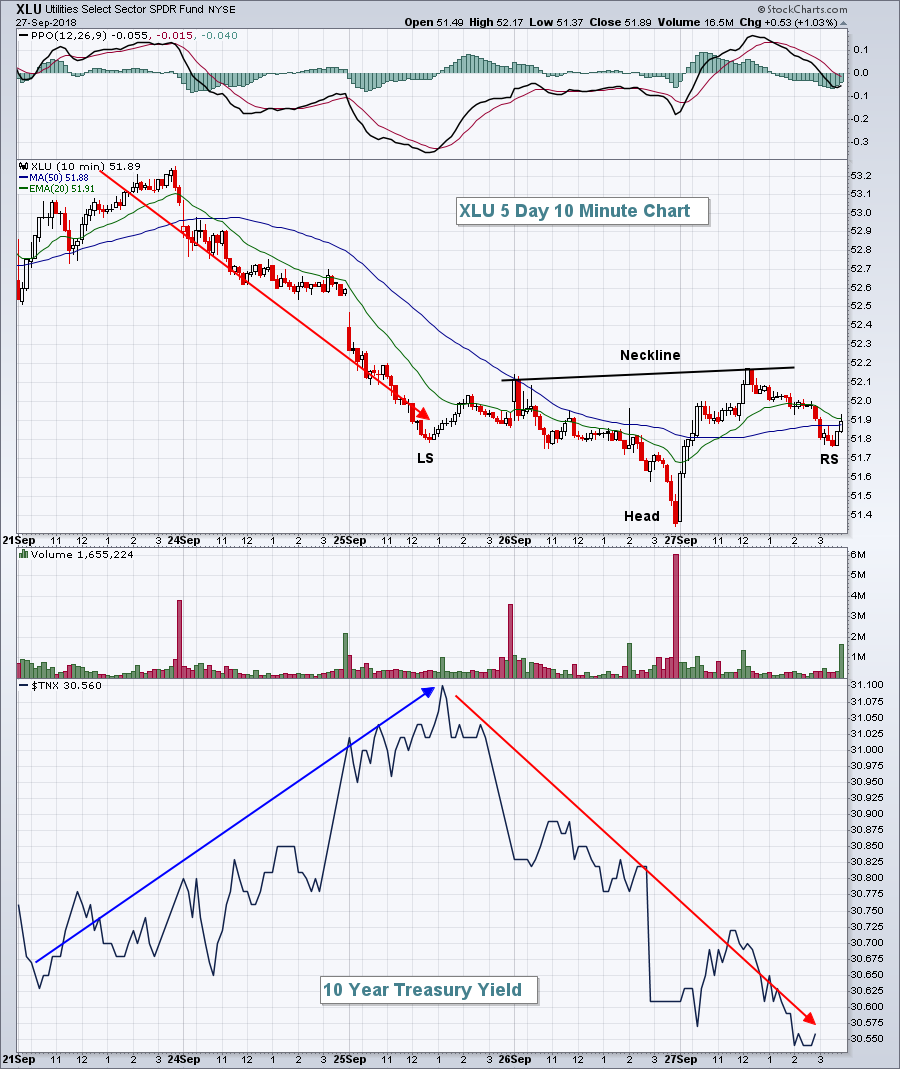
Utilities (XLU, +1.03%) rebounded solidly on Thursday after trending lower most of September. The group appeared to benefit from the failure of the 10 year treasury yield ($TNX) to break out. 3.11% is yield resistance on the TNX from the May 2018 high, which is also a 7 year high. If you look at the following chart, as the TNX hit that yield resistance and failed to break out, the XLU began to form a bottoming reverse head & shoulders pattern:
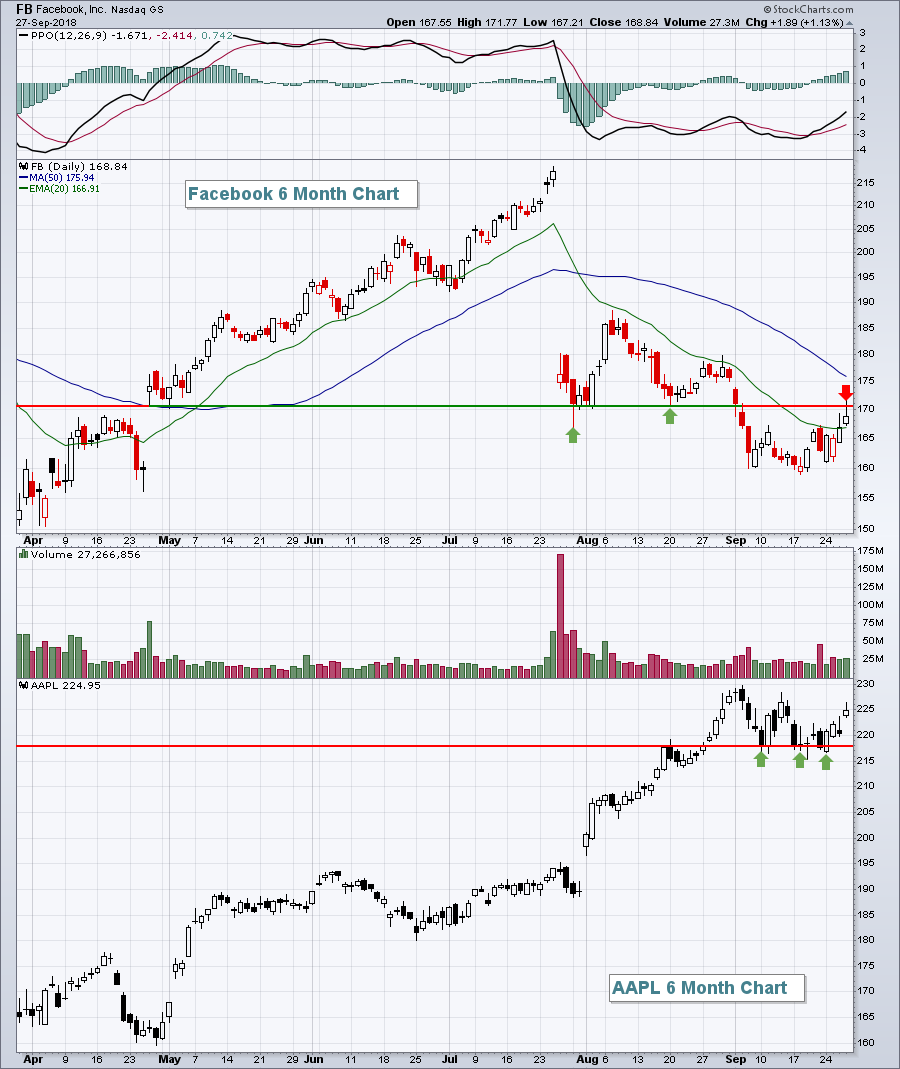
 Communication services (XLC, +0.86%) and technology (XLK, +0.59%) both finished higher on Thursday to help lead our major indices higher - the lone exception being the Russell 2000, which ended up losing 1 point on the session. Facebook (FB) helped lead the XLC higher as it broke out above its 20 day EMA and Apple (AAPL) led the technology sector higher. FB has overhead price resistance issues, however. AAPL looks much stronger to me:
 Materials (XLB, -0.87%) struggled again on Thursday. I take a closer look at the XLB in the Sector/Industry Watch section below.
Pre-Market Action
Asian markets were higher overnight, but Europe is mostly seeing red this morning. Dow Jones futures are taking their cue from Europe, down 76 points as we approach today's open.
Current Outlook
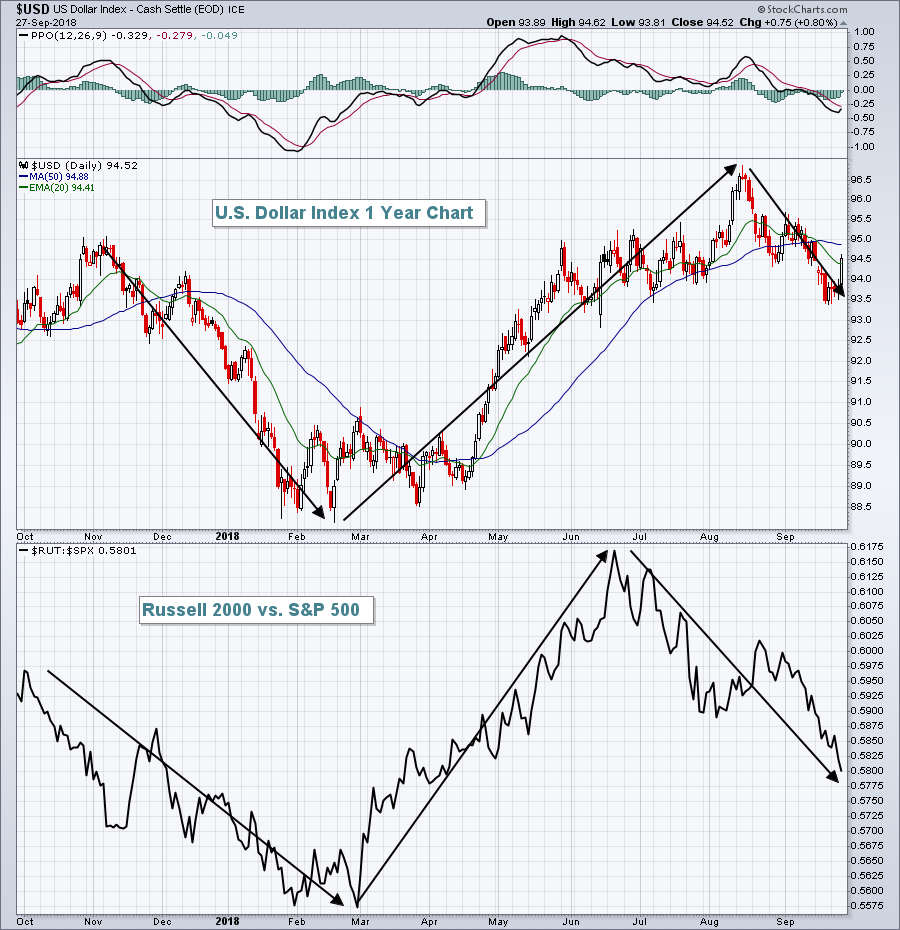
The U.S. Dollar Index ($USD) gapped higher yesterday to leave the last five days' action in an island cluster pattern. This is a reversing pattern so I'd look to see renewed strength in the USD, potentially lifting small caps' relative performance:
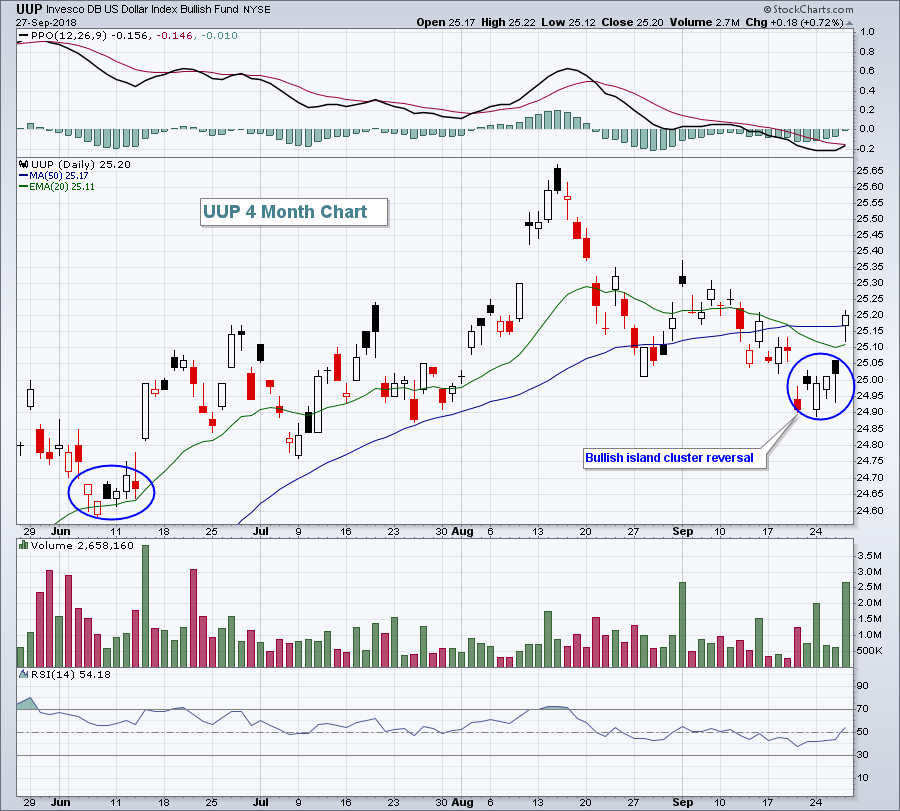
 While the relationship/timing isn't perfect, a rising dollar tends to be a positive for small cap relative strength. The UUP is a proxy for the dollar and actually shows yesterday's gap and island cluster reversal much clearer:
Sector/Industry Watch
It's been a rough week for the materials sector and its chart illustrates the importance of respecting price resistance:
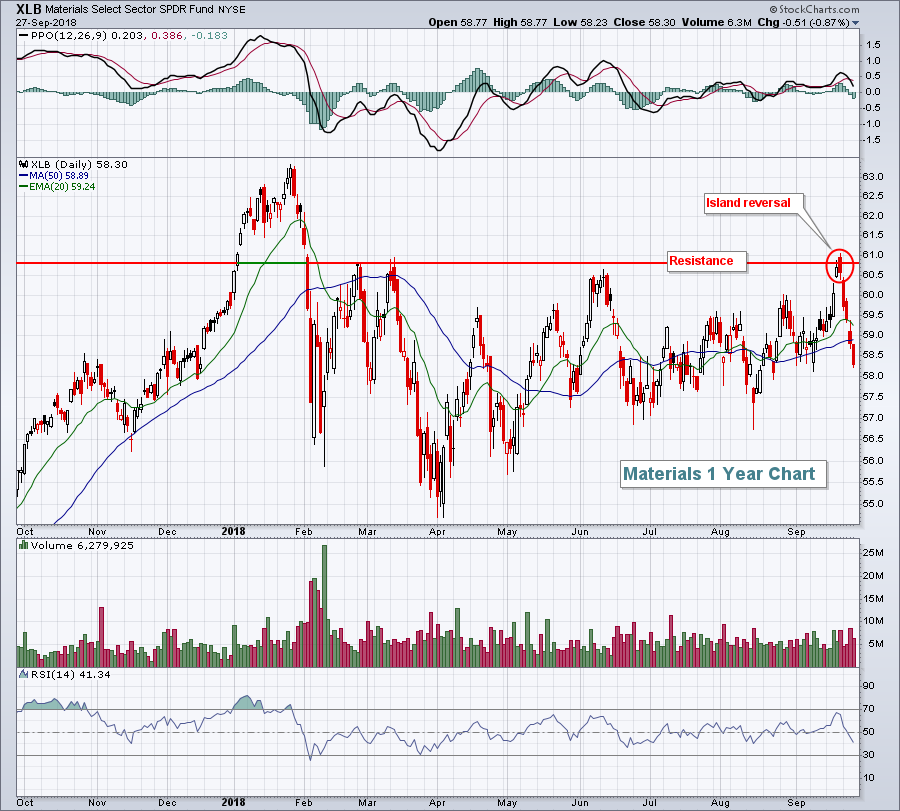 We haven't seen a close above 60.75 in several months. Despite the open above resistance last Friday, the XLB couldn't close there and we've seen a ton of selling since. Also, note the island reversal that occurred there as well. Now the XLB will be looking for recent price support from 57.00-57.50 to hold.
Historical Tendencies
Generally, the first several days of a calendar month are bullish. However, that's not been the case for small caps in early October. The Russell 2000 (since 1987) has produced an annualized return of -65.01% from October 1st through October 9th.
Key Earnings Reports
(actual vs. estimate):
BB: .04 vs .01
MTN: (2.07) vs (2.31)
Key Economic Reports
August personal income released at 8:30am EST: +0.3% (actual) vs. +0.4% (estimate)
August personal spending released at 8:30am EST: +0.3% (actual) vs. +0.3% (estimate)
September Chicago PMI to be released at 9:45am EST: 62.3 (estimate)
September consumer sentiment to be released at 10:00am EST: 100.8 (estimate)
Happy trading!
Tom


