Market Recap for Tuesday, November 20, 2018
It was another ugly day for U.S. equities as the February price support on our major indices draws closer and closer. Volatility shot higher as panicked, impulsive selling once again gripped Wall Street. Energy (XLE, -3.28%), consumer discretionary (XLY, -2.26%) and financials (XLF, -2.20%) were hit hardest, especially the apparel retail industry ($DJUSRA, -6.01%) within consumer discretionary. I discuss the weakness there in the Sector/Industry Watch section below.
While industrials (XLI, -2.07%) was not hit quite as hard as the other sectors above, there were two industry groups - heavy construction ($DJUSHV, -5.19%) and railroads ($DJUSRR, -5.00%) - that suffered significant losses. The latter is quite notable as it's a proxy for the U.S. economy. In October, the DJUSRR appeared to break a significant trendline, but it quickly moved back above it. Yesterday's decline, however, re-establishes that breakdown in a group that now appears to be reeling:
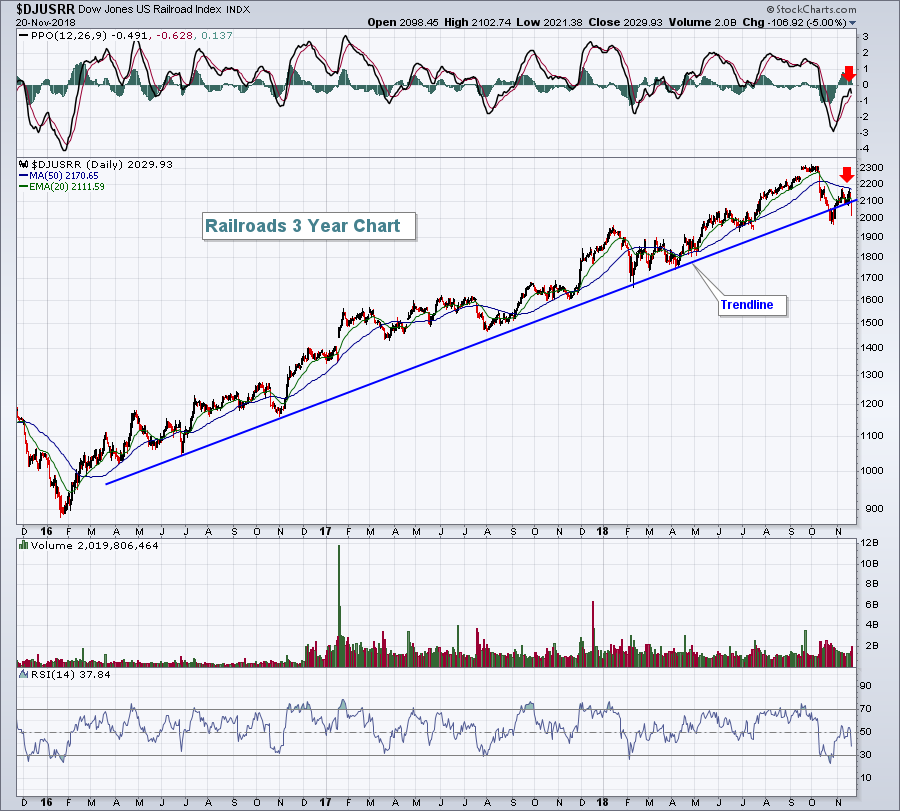
Railroads don't transport goods to Europe or Asia. It's a North American thing. When small caps are underperforming and railroads break down, it's time to re-assess what the Fed is telling us. They tell us the U.S. economy is strengthening. And it may be true that the U.S. economy is stronger than other parts of the world, but the U.S. stock market is a very strong leading economic indicator and it's beginning to paint a different picture than the Fed's rhetoric. I'm not saying "bear market" just yet, but the picture has most definitely turned a bit cloudier than before. If February price support on the S&P 500 is lost, then I'd begin trading based on bear market rules - until the stock market can prove to me otherwise.
Computer hardware ($DJUSCR, -4.39%) took another big hit as Apple (AAPL, -4.78%) closed at its lowest level since May. Semiconductors ($DJUSSC, +0.27%), meanwhile, managed to avoid the carnage although I don't believe this group has seen a bottom yet. We'll see.
On the positive side, defensive sectors continued to shine on a relative basis. Utilities (XLU, -0.42%) fell, but clearly outperformed the broad market.
Pre-Market Action
After another very steep drop yesterday in crude oil prices ($WTIC, -6.59%), we're seeing at least a temporary rebound. At last check, crude is higher by roughly 2.50%. Gold ($GOLD) is up more than $5 per ounce to $1226 this morning as it continues its climb towards the top of its $1180-$1240 trading range.
Asian markets were mixed overnight, while European markets recover this morning from yesterday's rout. The German DAX ($DAX) tumbled 1.58% to close at its lowest level since December 2016. There's a tight positive correlation between the DAX and S&P 500, so continuing weakness there is a negative for U.S. equities.
U.S. futures are pointing to a recovery at today's open with Dow Jones futures higher by 144 points with less than 30 minutes to the opening bell. On any rally, the first key test of resistance will be the declining 20 hour EMAs on our major indices.
Current Outlook
The Volatility Index ($VIX) surged on Tuesday, gaining 11.84% and finishing at 22.48, its highest close in November. A rising VIX means rising expectations of short-term volatility. That's almost always associated with falling equity prices and increasing fear. And VIX readings in the 20s and higher can lead to periods of impulsive or panicked selling where prices fall extremely rapidly with seemingly few buyers. The good news, however, is that these heightened levels of fear mark very significant market bottoms - bottoms that we don't want to violate. On the S&P 500, that level is 2582 on a closing basis:
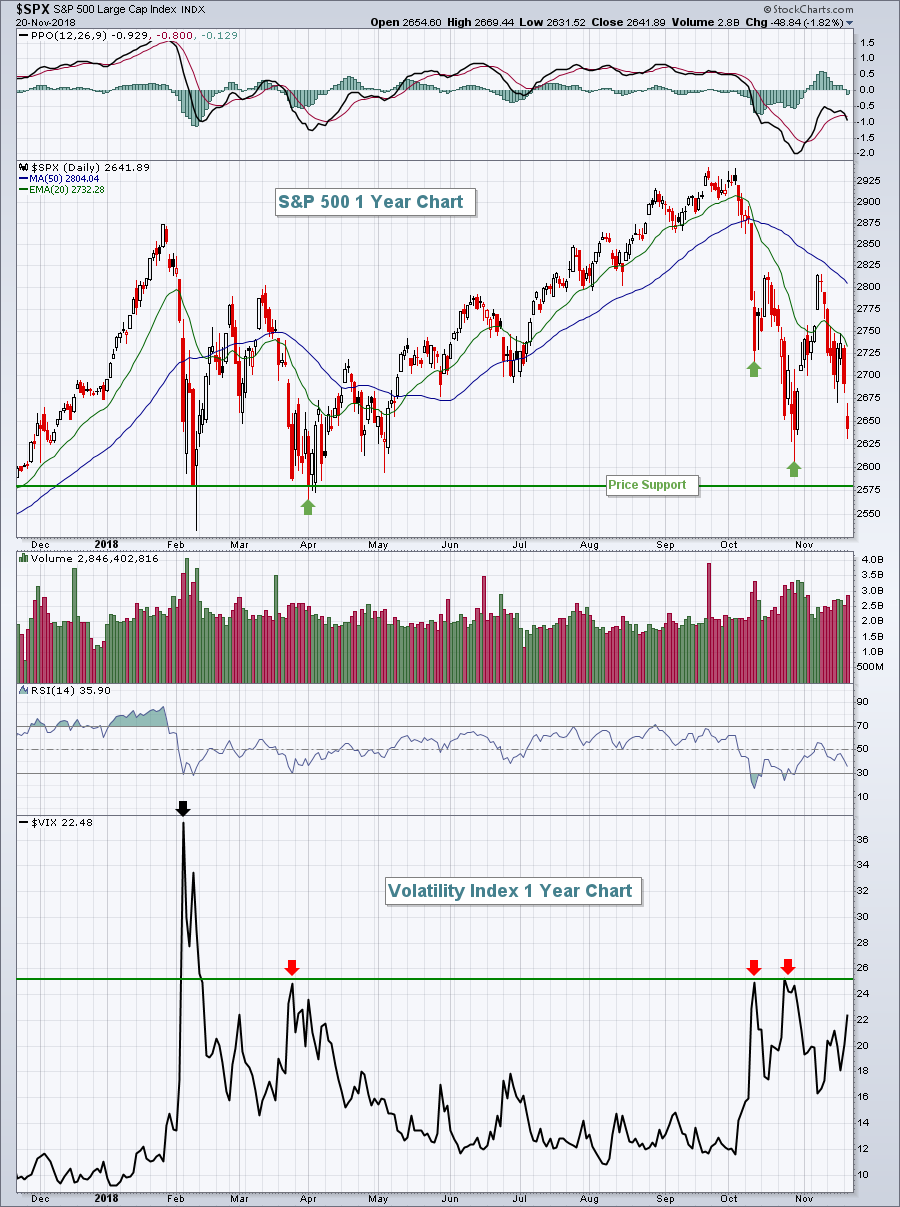 The first thing that really jumps out at me on this chart is the VIX reading from February. Historically, we don't see many VIX closes near 40. The intraday high reached 50 - again not witnessed very often. So in my view, the S&P 500 low that accompanied that type of panicked selling is critical support. We saw a similar development in 2014, followed up by tests of price support created by that initial bout of panicked selling. We held that support, though, and the bull market lived on. That's what I'm watching now. Can we hold that February closing support of 2582? I think we're about to find out.
Sector/Industry Watch
Two weeks ago, it could have been argued that apparel retailers ($DJUSRA, -6.01%) was the strongest industry group, but its huge drop on Tuesday extended its losing streak to eight consecutive sessions. During this weakness, the DJUSRA has fallen from 1040 to 862. That's a 17% assault in eight days! What the heck has happened? Well, the weekly chart had a big clue:
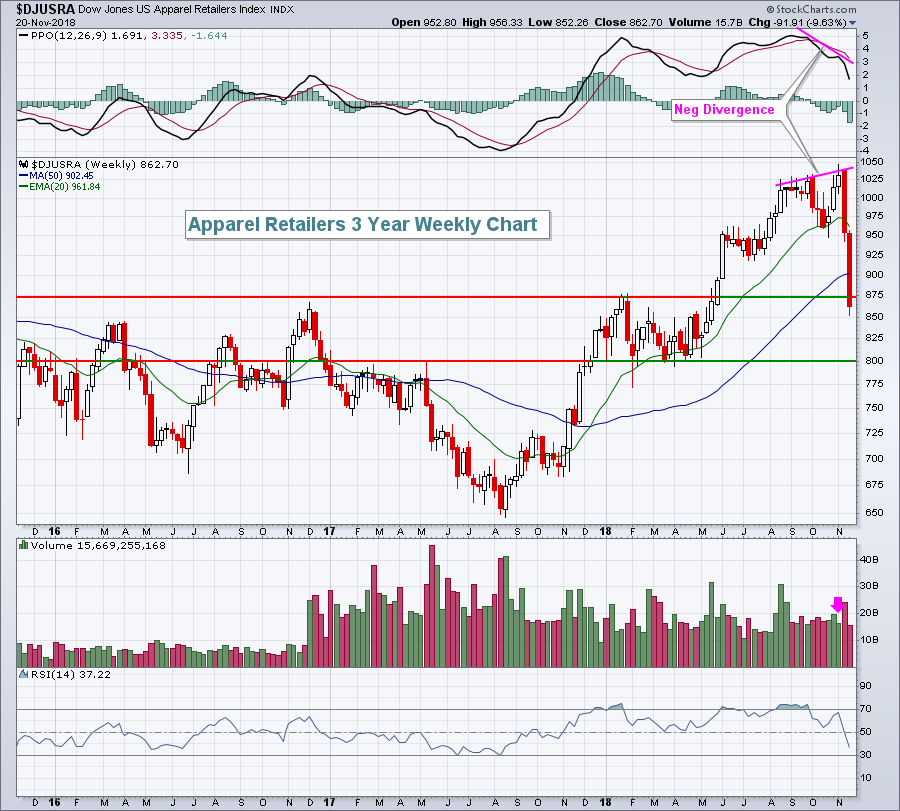 The DJUSRA opened November with fresh new highs, but did so with slowing price momentum (negative divergence) and light volume - another sign of slowing momentum. When I see that, I typically look for a 50 period SMA test or, in this case, a 50 week SMA test and a PPO centerline test. The former was accomplished near 900, but we've seen the group continue to fall to yesterday's close at 862. The two horizontal lines highlight the two key levels of price support, the first of which was taken out with the drubbing on Tuesday. If this is truly just a correction, the DJUSRA is likely at or approaching a very strong buy point. I need to see a reversal in the major indices first, however, and a long tail to the upside on the VIX.
Historical Tendencies
Beginning today, the NASDAQ enters into a very bullish historical period that lasts through December 5th. This period has produced annualized returns of +47.46% since 1971.
Key Earnings Reports
(actual vs. estimate):
DE: 2.30 vs 2.44
(reports after close, estimate provided):
SQM: .39
Key Economic Reports
October durable goods released at 8:30am EST: -4.4% (actual) vs. -2.5% (estimate)
October durable goods ex-transports released at 8:30am EST: +0.1% (actual) vs. +0.4% (estimate)
Initial jobless claims released at 8:30am EST: 224,000 (actual) vs. 215,000 (estimate)
November consumer sentiment to be released at 10:00am EST: 98.3 (estimate)
October existing home sales to be released at 10:00am EST: 5,210,000 (estimate)
October leading indicators to be released at 10:00am EST: +0.1% (estimate)
Happy Thanksgiving and happy trading!
Tom


