Market Recap for Monday, November 19, 2018
I'd like to say something good about yesterday's action on Wall Street, but I don't think there's anything to be said. Impulsive selling returned with little in the way of a bid on technology stocks (XLK, -3.81%) as this highly-influential sector fell to its lowest level in over six months. The best performing industry group within technology was telecommunications equipment ($DJUSCT), which only lost 1.71%. Essentially, where there was technology, there were losses. And some mighty big losses at that. Several high-flying software stocks ($DJUSSW, -4.56%) for 2018 are very quickly seeing their business valuations recalculated. The stock market looks ahead and the message that it's currently sending is that the expected growth rates of many aggressive technology companies will not materialize. Accordingly, they're being sold off hard first with questions to be asked later. First, let's look at the XLK and DJUSSW:
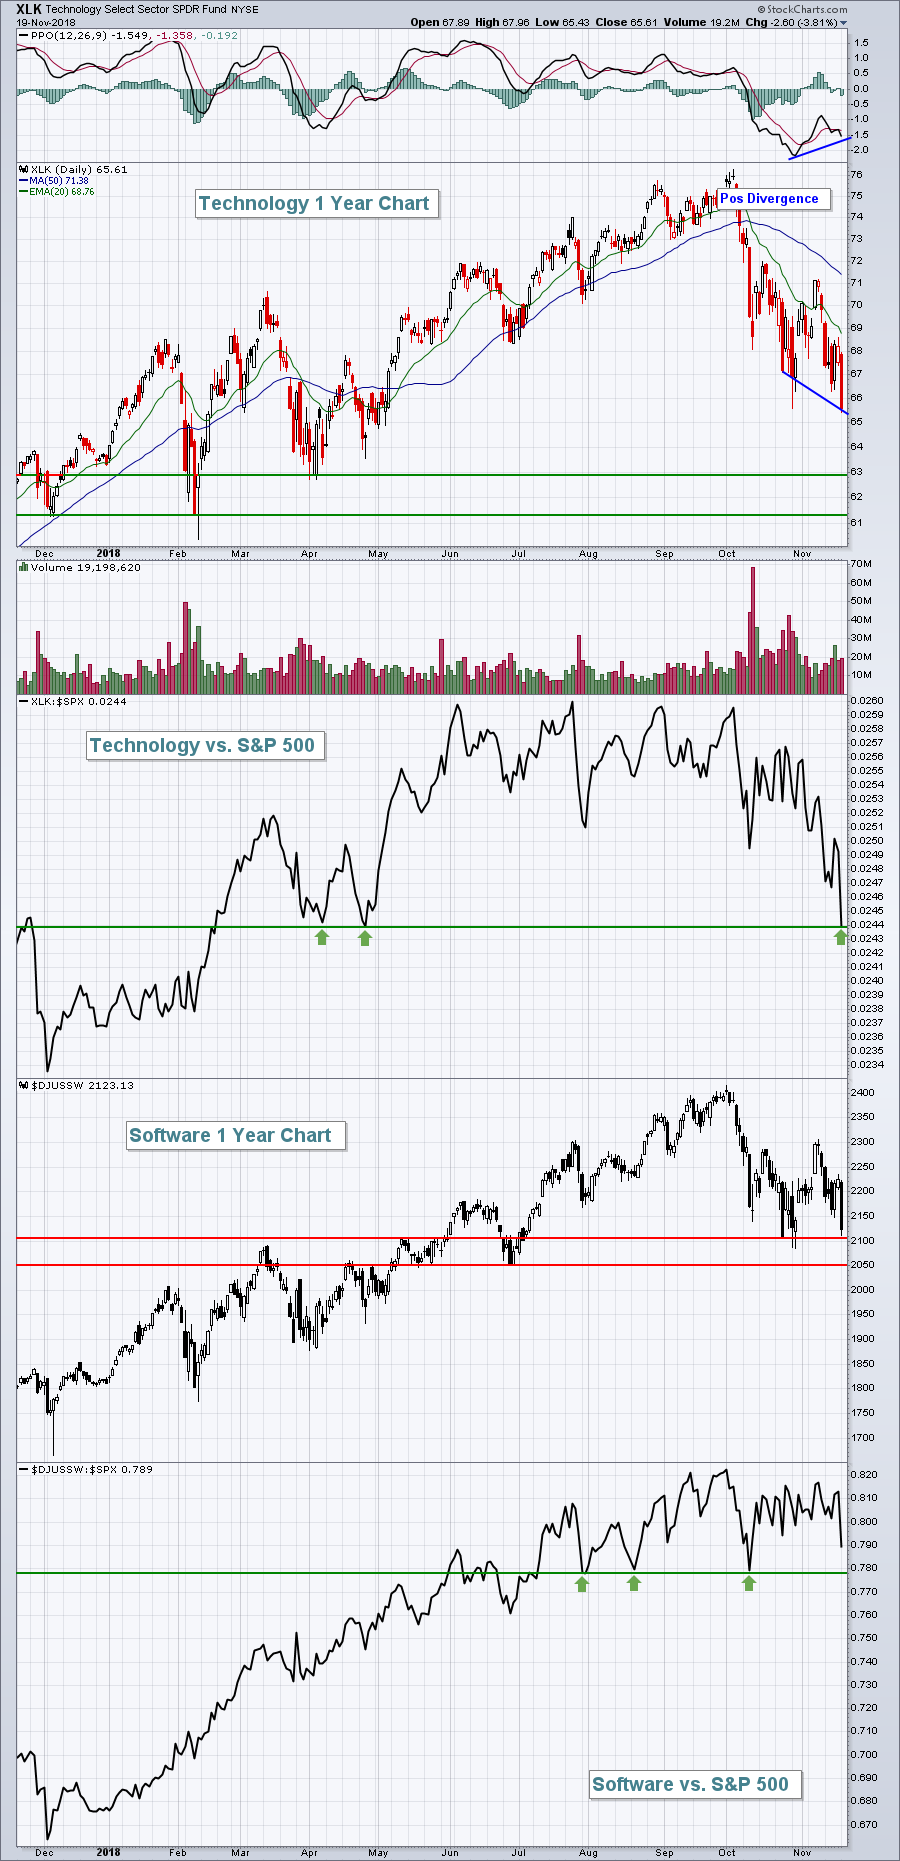 I've used the support/resistance line on the charts above to identify levels that I view as very important. Both relative charts - technology vs. S&P 500 (XLK:$SPX) and software vs. S&P 500 ($DJUSSW:$SPX) - are at or nearing very important intermediate-term relative support levels. In particular, the $DJUSSW:$SPX has three very clear relative support tests just beneath .78. A break below this level would be very damaging technically as it would clearly suggest that money has moved on from software stocks.
But software was only part of the problem. Communication services (XLC, -3.03%) and consumer discretionary (XLY, -2.44%) also were hit hard. The former struggled because internet stocks ($DJUSNS, -4.61%) took another big hit. A couple of high-profile internet names - Facebook (FB, -5.72%) and Netflix (NFLX, -5.45%) - led the charge lower, both on expanding volume and both with very bearish looking charts. Here they are:
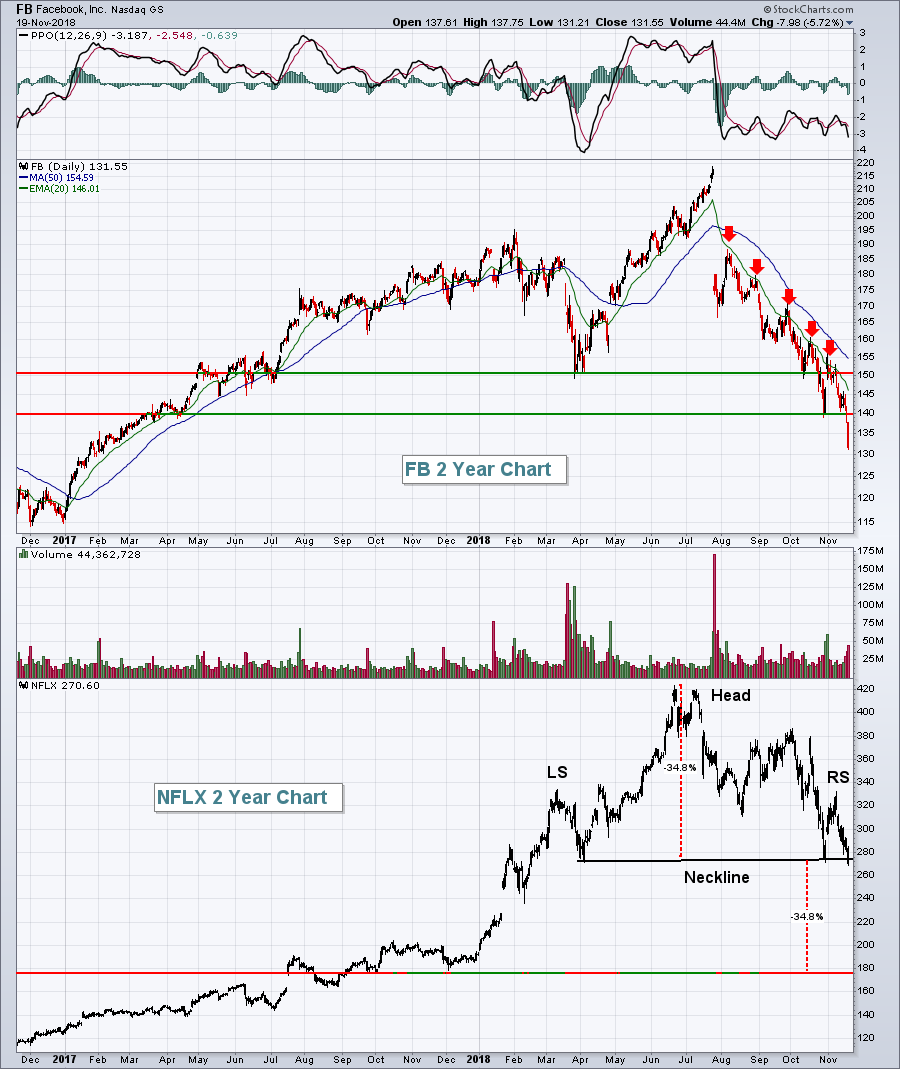 After the FB earnings debacle in July when they unexpectedly lowered their operating margin estimates from 45% to 35%, I said FB was heading for 100. I stand by that call. What I didn't see coming, however, were the big drops in other FAANG stocks, most notably NFLX above. That breakdown on NFLX now suggests a price target beneath 200. It's hard to imagine FB going to 100 and NFLX falling beneath 200 without a bear market in place. The only way to avoid a bear market, in my view, is for rotation to be significant to other areas of the market. While we've seen that with defensive areas, I'm suggesting we need to see it in several aggressive areas as well. Restaurants & bars ($DJUSRU) have been one such area where we've seen money rotate, but we need several more. If not, we'll likely see other significant breakdowns, most notably in our benchmark S&P 500.
Pre-Market Action
The 10 year treasury yield ($TNX) is down to 3.04%. A break below 3.00% would suggest an unusual amount of money rotating into defensive treasuries, so let's keep an eye on that level.
Asian and European markets both are extending losses on the heels of a very weak performance by U.S. stocks yesterday. Dow Jones futures are pointing to yet another big selloff this morning, down 376 points at last check and less than 30 minutes from today's opening bell.
Current Outlook
Is this a bear market? It's a question that gets bantered about everywhere whenever we see an extended period of weakness in equities. I'd certainly call this an extended period of weakness. And as I mentioned earlier, watching FAANG stocks getting obliterated in a very short timeframe suggests this certainly could be more than just your ordinary correction or pullback. The ultimate line in the sand for me is price action on the benchmark S&P 500. Yes, it's been weak. But price weakness is normal during both bear markets and corrections. The difference, however, is whether panicked, highly volatile market selloffs hold as support over the intermediate- to longer-term. Panicked selloffs mark critical price support levels. When we look at a long-term chart of the S&P 500 and the VIX spikes, we can mark with accuracy the key levels of price support to watch:
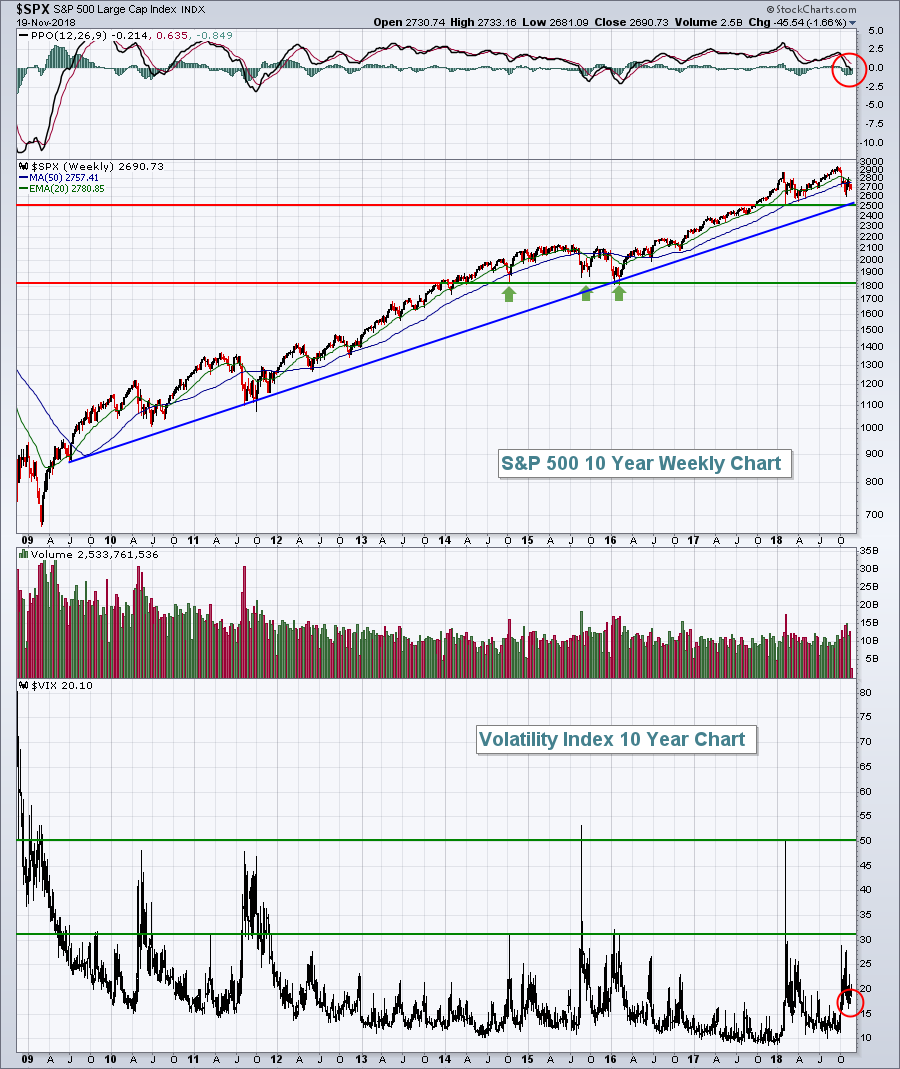 The current market action reminds me a lot of what we went through over 15-16 months from late-2014 through early-2016. I know it was a few years ago, but the current price pattern is eerily similar. After an extended bull market advance from 2012 through 2014, we stumbled badly for the first time in October 2014. The VIX spiked to its highest level in 2 1/2 years and we marked a VERY important price low just above the 1800 level. The stock market recovered in 2015 to establish new highs on the S&P 500. Sounds very familiar to our high volatility selloff in January/February 2018 to establish a critical support level just below 2600. We then moved higher to set a fresh all-time later this year. In 2015 and 2016, volatility soared later as that price support near 1800 was tested - but never lost. In October 2018, we also saw volatility return and we moved down close to that 2600 level, but we didn't lose it. Now here we come again. Volatility is high and we're not far from testing that critical price support level again. Until that price support level is lost, I believe this is a correction, not a bear market
However, let me point out a couple of bearish developments that are worth noting. The red circles on the chart above highlight two necessary ingredients of a bear market. First, the weekly PPO has now fallen below centerline support. You cannot have a bear market without a negative weekly PPO. It's impossible so price momentum has taken a necessary first step to a bear market. Second, the VIX did not drop below 16 on the last bounce in the S&P 500. During each of the last two bear markets, the VIX never fell below 16. A certain level of fear is required to sustain price action to the downside. Our recent bounce in the S&P 500 was accompanied by a drop in the VIX, but only to 16. The VIX is trending higher once again and yesterday closed over 20.
Sector/Industry Watch
The past 2-3 months have been very difficult for a number of industry groups. There's plenty of competition for worst industry group performance since mid-August, but the winner is.....
The Dow Jones U.S. Toys Index ($DJUSTY).
Its early October high of 1198 seems like a distant memory after yesterday's 3.89% drop to 805. That's nearly one-third of the index value lost in less than two months. On a long-term weekly chart, we could be approaching an area where buyers will begin to get interested:
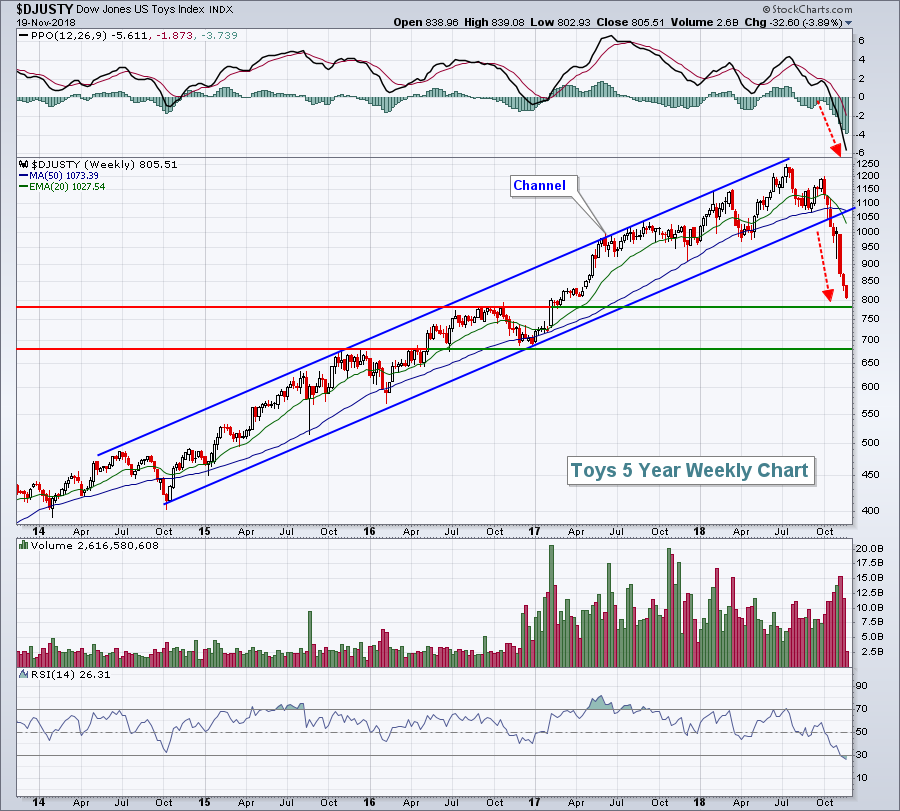 Those two green horizontal lines is where I'd look for a potential rebound to begin. Sometimes it's difficult to visualize bullish and bearish happenings on a chart, but I think just about everyone can agree that there's not much bullish about this DJUSTY chart. A multiyear uptrend channel has clearly broken down and very impulsive selling has taken over. The weekly RSI has fallen below 30 so the toys group is most definitely oversold, but your timing must be perfect on a bounce. The good news is that we could see a very significant bounce with the declining 20 week EMA at 1027, though dropping rapidly.
Glu Mobile (GLUU, -10.56%), which recently posted excellent quarterly results, had easily been the best performing stock within the toys industry group. But Monday's big decline saw GLUU lose its 20 and 50 day moving averages, along with gap support. Hasbro (HAS, -2.89%) is probably the safest play in the toy space as it's seen only an 11-12% decline and it's a larger cap stock with a much longer history than a stock like GLUU. Nonetheless, HAS is also weakening as money rotates away from the DJUSTY.
Historical Tendencies
At the close today, the S&P 500 begins a bullish historical period that runs from November 21st through December 6th. The S&P 500 has produced annualized returns of +33.71% during this period since 1950.
Key Earnings Reports
(actual vs. estimate):
ADI: 1.55 vs 1.52
BBY: .93 vs .85
CPB: .79 vs .69
HRL: .51 vs .46
JEC: 1.31 vs 1.22
KSS: .98 vs .96
LOW: 1.04 vs .97
MDT: 1.22 vs 1.14
ROST: .91 vs .90
TGT: 1.09 vs 1.11
TJX: .63 vs .61
(reports after close, estimate provided):
ADSK: .26
CPRT: .46
FL: .92
GPS: .68
KEYS: .91
Key Economic Reports
October housing starts released at 8:30am EST: 1,228,000 (actual) vs. 1,240,000 (estimate)
Happy trading!
Tom


