Market Recap for Wednesday, December 26, 2018
After gapping higher on Wednesday, our major indices retreated initially to lose all of its opening gains. The Dow Jones traded approximately 300 points higher right out of the gates, but within 90 minutes had lost those gains and was down 80 points. I'm sure most everyone was thinking "Here we go again!" But this time, buyers emerged and the Dow Jones went on to post historic gains. By day's end, the Dow Jones finished higher by 1,086 points, or 4.98%. It's had higher percentage gains before, but never such a point gain. It would be so much better if these gains had occurred because of something fundamental that might last. Instead, however, it was simply a massive relief rally from the worst December on record.
Volatility ($VIX) had reached an extreme level at Monday's close when it finished just above 36. As I posted previously, the VIX had hit 37 and 34 during the initial price breakdowns in the two previous bear markets. That was a clear indication to me that we were at or nearing a major bear market bottom. Unfortunately, it's not likely to be the final one. We have to start somewhere, though, and it's nice to have a price support level to monitor as we move forward. Here's what we should be watching in the coming days, weeks and months:
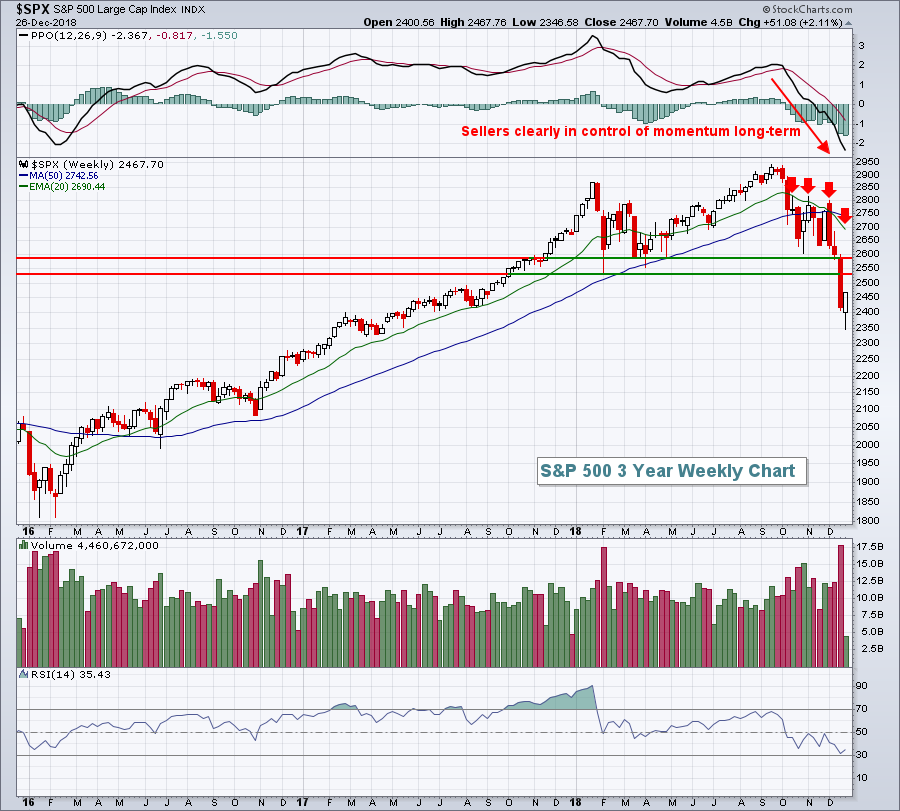 On this longer-term weekly chart, the S&P 500 bears will have multiple defenses. The obvious defense is price resistance. Previously, 2581 had marked closing price support on the daily chart and 2532 had marked intraday price support. So that range to the upside, 2532-2581, will provide key overhead resistance. The declining 20 week EMA is at 2690, but will be dropping rapidly. The combination of these three price levels will be most interesting to watch, along with VIX readings of course. I would expect another round of selling before the VIX ever drops below 20. That has been the history of early stage bear markets.
There's not really any reason to highlight individual sectors on industry groups as just about every area of the market bounced because it was extremely oversold. Suffice it to say that all 11 sectors were higher and every industry group was higher, except for gold mining ($DJUSPM, -0.43%). The DJUSPM, however, looks very solid and one of the few areas that I'd buy from a technical perspective. There was much more money to be gained in oversold areas yesterday, so the DJUSPM paid the price. But as this bear market regains its grip on the weeks and months ahead, I'd expect the DJUSPM to be a significant outperformer.
Pre-Market Action
Volatility is the name of the game right now. Don't believe me? Just look at the futures this morning. After a 650 point decline on the Dow Jones Monday, we saw a 1000+ point rally yesterday and this morning futures are lower by 340 points. The net effect? Nil.
The 10 year treasury yield ($TNX) is falling again, yet another reminder of the weaker economic environment that bond traders are expecting in 2019. As the TNX falls, it means money is rotating into treasuries, a negative for equities. That reality is reflected in stock futures this morning. Crude oil ($WTIC) rallied strongly yesterday, but is stumbling a bit this morning, down 1.50% at last check. Gold ($GOLD) is rallying $4 per ounce to $1277 after a small selloff on Wednesday.
The Tokyo Nikkei ($NIKK) rallied strongly overnight, gaining 3.88%. European markets are down sharply this morning.
Current Outlook
We've established a price support level to watch now. So the next major question is how high might we bounce? Let's look at the past two bear markets to see the type of reaction highs seen after the "correction to bear market" price breakdowns. First, the 2007-2009 bear market:
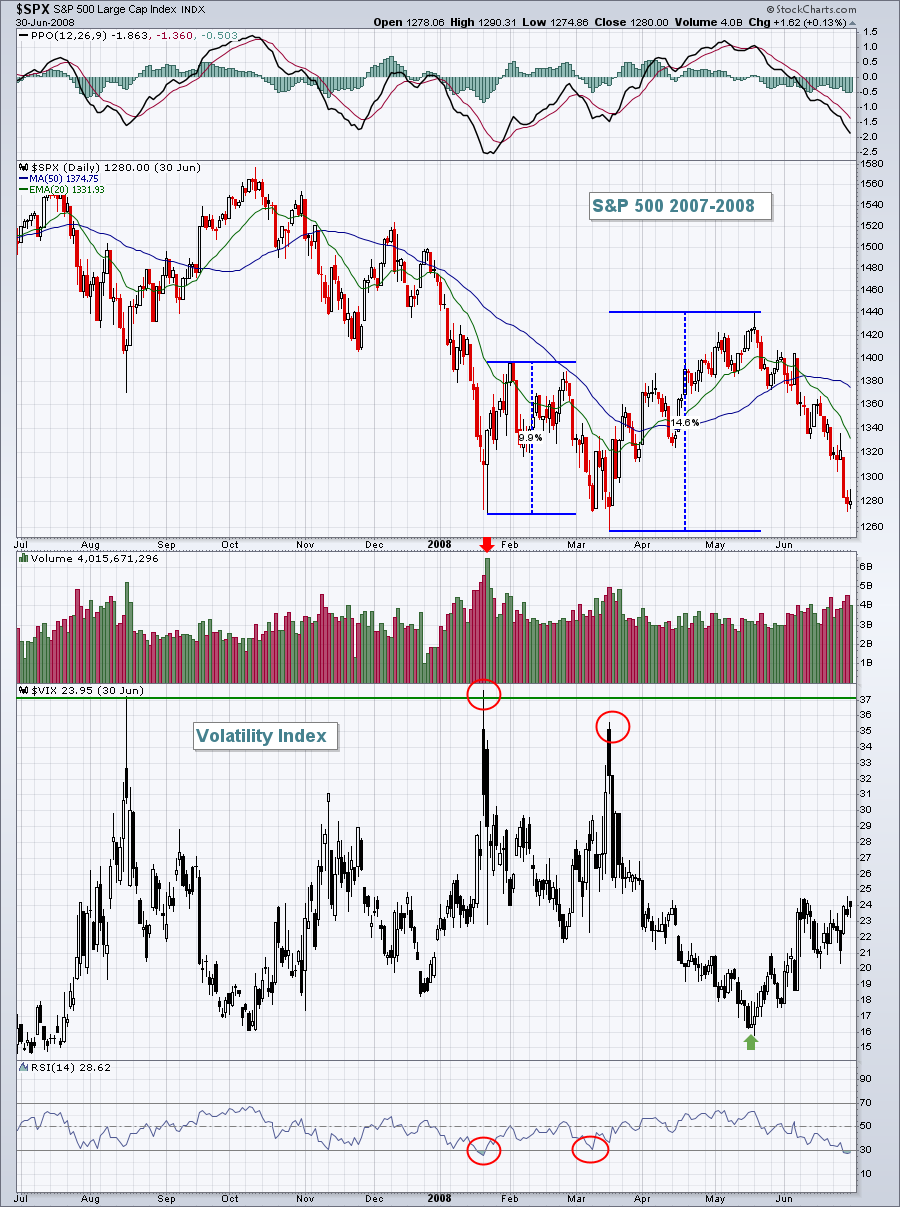 We saw the "correction to bear market" breakdown in January 2008. The bottom occurred when the VIX hit 37 and the reaction high two weeks later was roughly 10%. After moving down to retest the initial support level, we saw another huge rally, this one more than 14% and a temporary breakout above the prior reaction high. That second high was established when the VIX fell to 16. As I've noted on several previous occasions, the 16-17 support level on the VIX has not been violated during either of the prior two bear markets. The level of fear plays a HUGE role in trading bear markets. Excessive fear marks key bottoms and as fear evaporates and overhead resistance approaches, we look for reversals (and begin shorting, if that's your style).
Let's look at the 2000-2002 bear market:
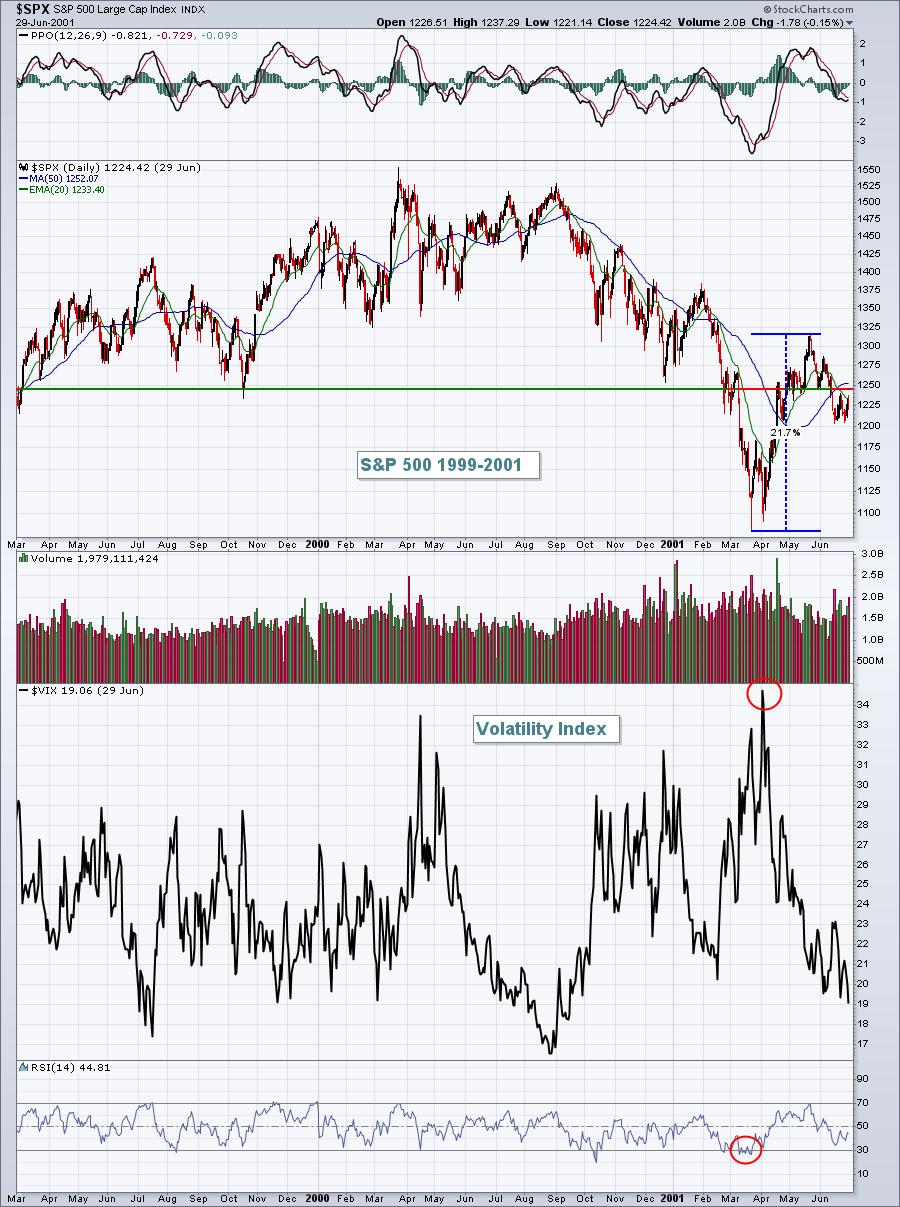 We see a similar pattern. The VIX moves into the mid-30s as a panicked, impulsive selling episode marks a key bottom. The S&P 500 initially bounces close to 10% and almost reaches the declining 20 day EMA before the selling kicks in again and we approach the prior low to establish a double bottom. The two month rally ends up providing a huge 21.7%, but look at the huge swings during that two month period. Looking back using 20/20 hindsight makes it seem simple - just buy at the bottom and wait two months and pocket a 20%+ gain, right? Trust me, it wasn't that easy back then and it won't be that easy this time either. Those intraday and intraweek moves were BIG and the emotional toll if you happened to be on the wrong side was monstrous. I find it nearly impossible to trade an emotional market like the one we're in now. For the past three weeks, there's been selling, panic and despair. Then, out of nowhere, the Dow Jones rallies 1000 points and CNBC's headlines are "Dow Jones Posts Its Biggest Gain EVER!!!" It's true, but let's keep things in perspective please. In my opinion, this rally - and it's going to be difficult to determine how long it lasts - will be an opportunity to exit longs before the next leg lower in 2019. Perhaps we'll be able to sustain the current rally, hold the price low established yesterday and trade higher in Q1. There's a reasonable chance that we'll do that, but it will come with crazy swings, swings designed to chase you out of your positions at just the wrong time.
There's only one thing that will cure this volatile market. Time. My goal, as a trader, will be to preserve capital. While that's always the goal, it's even more imperative now with risks so elevated.
Lastly, if you enjoy my analysis every day, please subscribe at the bottom of this article. Simply type in your email address in the space provided and click on the green "Subscribe" button. It's 100% FREE and you won't be spammed. You'll then receive my blog article directly in the email address provided as soon as my article is published. I'll do my best to bring you objective guidance throughout 2019 and beyond! Thanks so much! :-)
Sector/Industry Watch
Semiconductors ($DJUSSC, +5.79%) went along for the ride yesterday, essentially mirroring the NASDAQ's 5.84% gain. It was a nice relief rally, no doubt. Unfortunately, I wouldn't be calling a bottom in this group. Like so many areas of the market, it was simply oversold and ready for a sustained bounce and we got it:
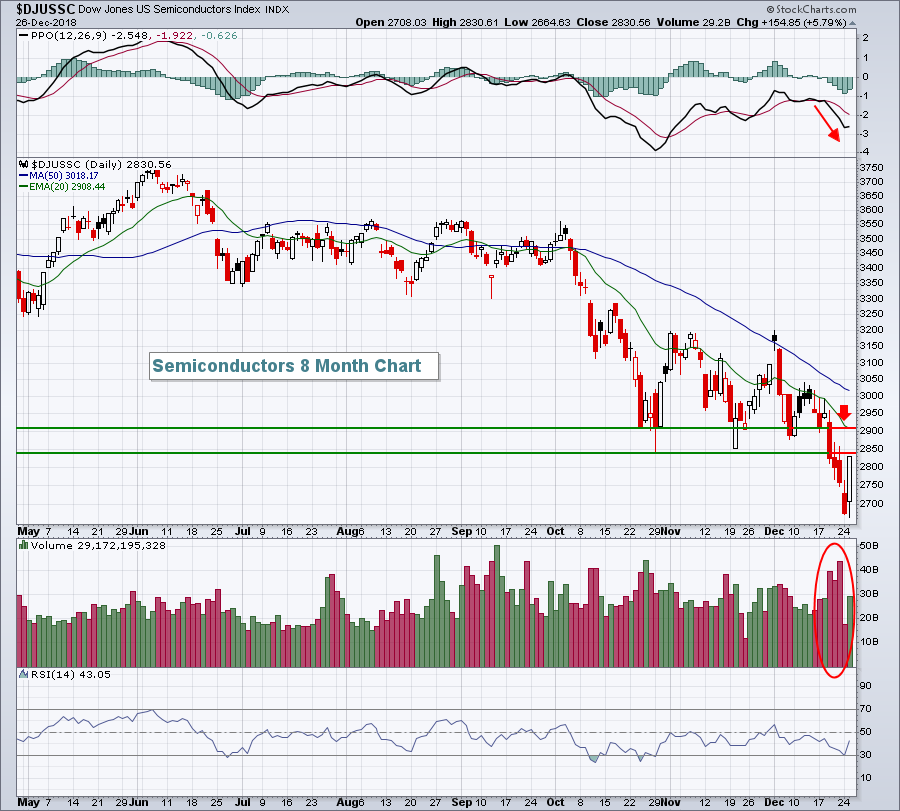 The PPO has turned lower, suggesting that sellers are in control. There's also a TON of overhead resistance ahead in the form of the declining 20 day EMA, and price resistance established with the recent high volume breakdown below prior price support. There's a bit more room to the upside, but I won't be impressed by this rally until we can at least close back above the 2910 level. That type of close would then appear to suggest a declining 20 week EMA test was probable and that would give the bulls a bit more room:
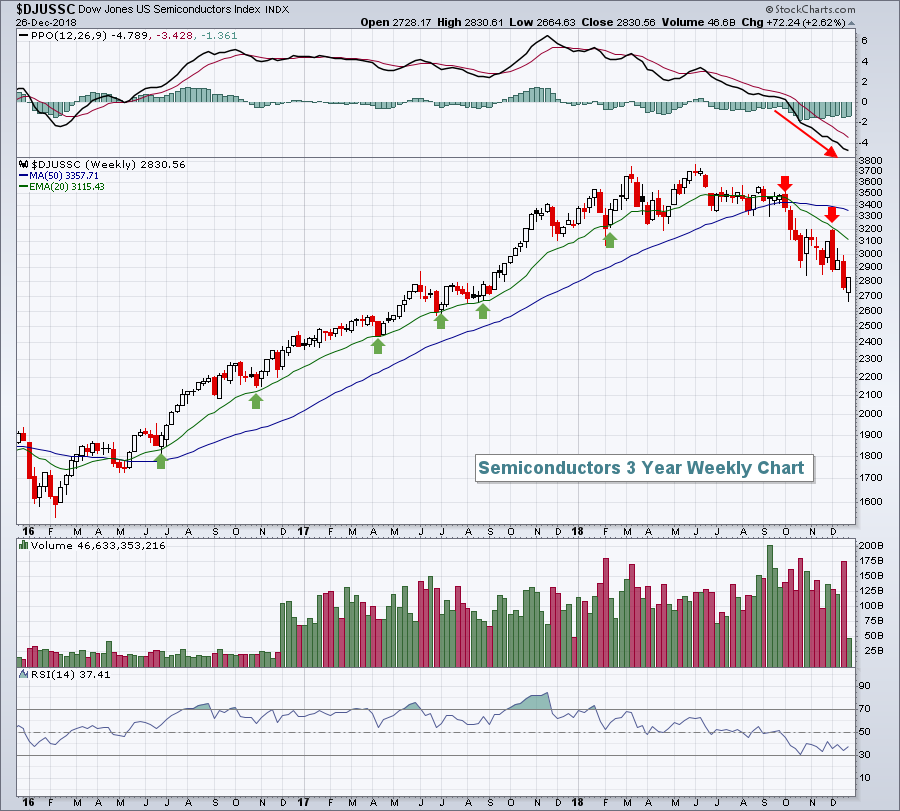 Yesterday's rally was obviously very nice and timely. But on this weekly chart, it's nothing more than a blip on the radar. The green arrows highlight how important the 20 week EMA is to support a long-term bull market rally. The red arrows are now beginning to mark something much more ominous. These 20 week EMAs are the bears' wild card in 2019 that they'll play if forced to - and they'll very likely work.
Historical Tendencies
It's been a brutal December as we all know, despite the fact that December is the best calendar month of the year historically for both the S&P 500 and Russell 2000. On deck is January, which has been the best calendar month of the year for the NASDAQ. The NASDAQ has produced annualized returns of +31.72% during January since 1971.
Key Earnings Reports
None
Key Economic Reports
Initial jobless claims released at 8:30am EST: 216,000 (actual) vs. 217,000 (estimate)
October FHFA house price index to be released at 9:00am EST: +0.2% (estimate)
December consumer confidence to be released at 10:00am EST: 134.0 (estimate)
Happy trading!
Tom


