Market Recap for Monday, December 24, 2018
It was an abbreviated session on Monday, but the losses were not abbreviated. The Dow Jones lost another 653 points, or 2.91%, while the S&P 500, NASDAQ and Russell 2000 posted losses of 2.71%, 2.21% and 1.95%, respectively. All 11 sectors fell rather hard, led by utilities (XLU, -4.18%), energy (XLE, -4.05%) and real estate (XLRE, -3.68%). Utilities and real estate had been spared for the most part during the Q4 drubbing as both sectors traded at 2018 highs earlier in December. They are quickly making up for lost time, however.
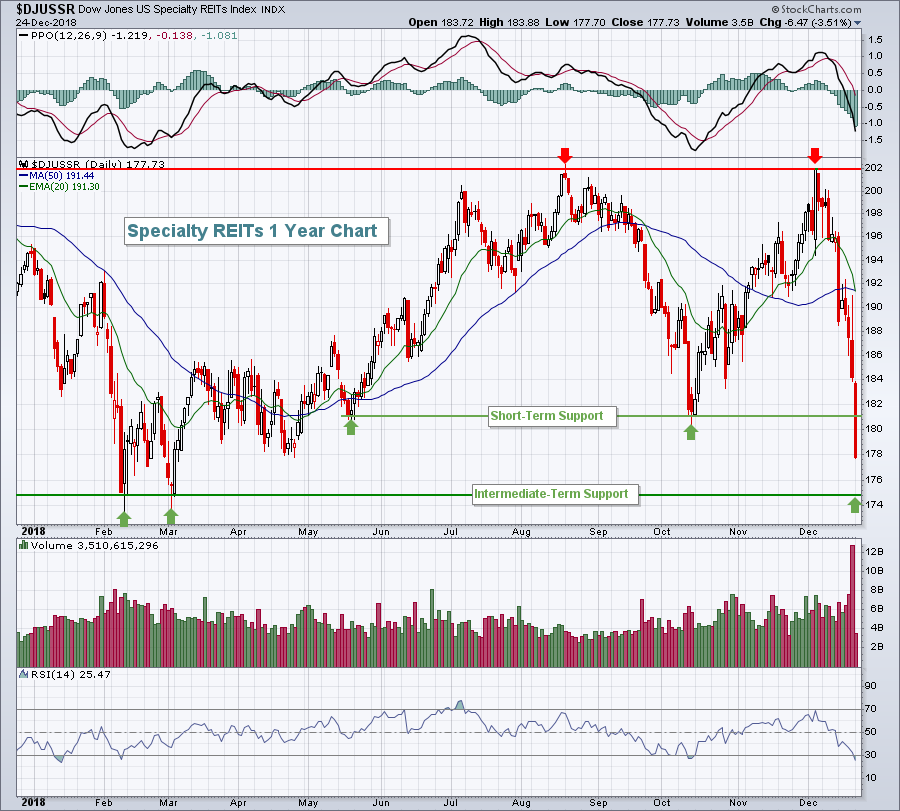
Three weeks ago, specialty REITs ($DJUSSR) were testing their August high. But in these past three weeks, the group has fallen back to test lows not seen since March:
 52 week highs to 9 month lows in three weeks. Unfortunately, that's the market we're facing.
Some of the biggest losers on the S&P 500 from Monday were consumer staples (XLP, -2.89%) companies. Kimberly Clark (KMB, -7.85%), Campbell Soup (CPB, -6.52%) and Clorox (CLX, -5.92%) were in spots 2-3-4 among the S&P 500 losers. Only energy-related Hess Corp (HES, -12.20%) performed worse. It was unusual seeing so many non-aggressive sector stocks littering the loser leaderboard, but it highlights the fact that no stocks are immune to the intense, impulsive selling felt in December. HES has fallen from a $20 billion market cap company to a $10 billion market cap company in the fourth quarter alone. On Monday, a major project was halted and HES suffered its worst day in nearly three years. It also didn't help that crude oil prices ($WTIC) dropped another 6.71% to close at $42.53 per barrel.
Consumer discretionary (XLY, -1.90%) outperformed on a relative basis, although none of its 20 industry groups managed to finish with a gain. Several groups, however, were incredibly oversold and resisted some of Monday's selling efforts.
Pre-Market Action
There's little in the way of earnings or economic news out today. The U.S. stock market instead will likely trade off of its weak technical conditions and the performance of global markets. Overnight, Asian markets were mixed with the Tokyo Nikkei ($NIKK) recovering from a Christmas Day rout in which the index lost more than 5%.
Crude oil prices ($WTIC) have rebounded close to 1% and currently trade just beneath $43 per barrel.
With roughly 45 minutes left to the opening bell, Dow Jones futures are pointing to a rebound at the open, currently higher by 112 points.
Current Outlook
Trying to call bear market bottoms is like playing Russian roulette. Being off by just a day or two can mean a HUGE difference in your portfolio. But history tells us that a bottom is rapidly approaching as the Volatility Index ($VIX) closed over 36 on Monday. The initial price breakdowns on the last two bear markets resulted in the VIX spiking to 34 and 37. I suspect we're within a day or two of marking a very significant short-term bottom. Of course, I said something similar just two days ago. But any time the VIX rises to current levels, I begin looking for a reversal to mark a bottom. I've been discussing the likelihood of a capitulation in my last few Trading Places articles. A comparison of today's bear market action to the last bear market in 2007-2009 can be found in my Trading Places article from last Friday. Check out the Current Outlook section in that article.
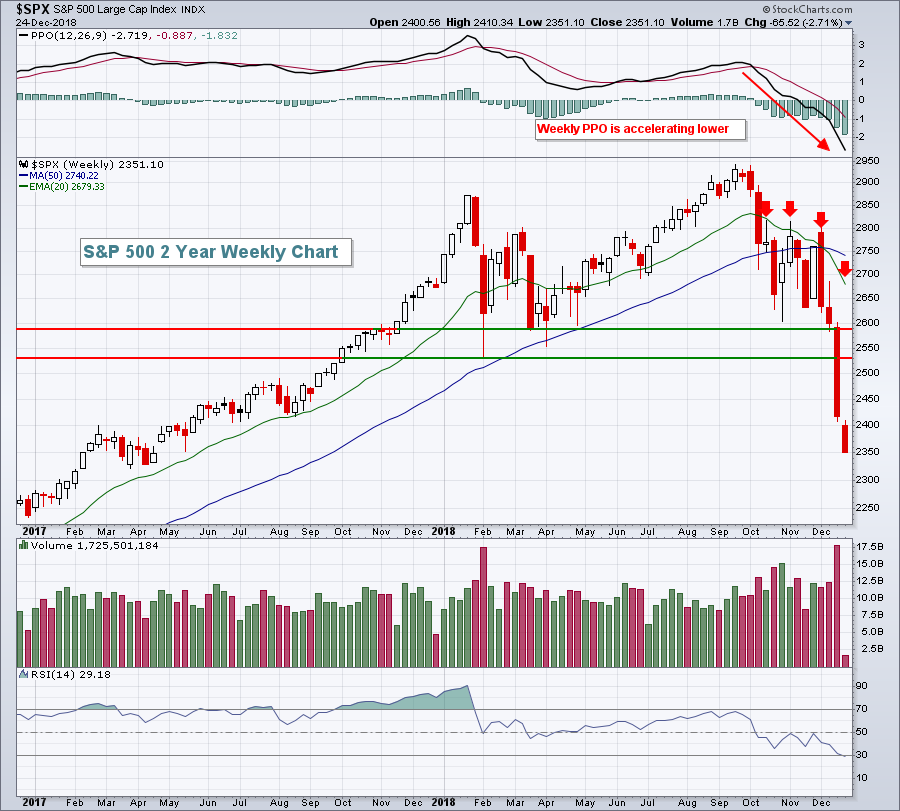
For today, let's review the long-term weekly chart:
 The weekly PPO is abysmal. The weekly RSI has now moved below 30 into oversold territory. The VIX is at 36. Massive volume accompanied the selling last week. If you believe that the stock market is a great leading economic indicator, then it's difficult to walk away from the above chart thinking anything other than there's a likely recession ahead.
We will bounce strongly, however, and it'll likely be sooner rather than later. Perhaps there will be news of a possible agreement between the President and Congress to end the government shutdown. I'm not sure what the news will be, but once the buyers emerge, I expect to see a 10% rally - and it could be very quickly. The problem, though, is that if the timing of your long entry is off by a day or two, capitulation could cost you another 5% or 10% or more before the reversal occurs. Trading in a high VIX environment is extremely dangerous. I won't likely buy individual stocks, but if I do, I'll look at big name, large cap stocks only. It might be Amazon.com (AMZN), Microsoft (MSFT), Boeing (BA) or a stock of that nature. The more likely choice for me will simply be to buy the ETF that tracks the S&P 500, or the SPY. Dollar cost averaging on the SPY with a VIX in the mid-30s makes some sense, but even that could require nerves of steel if the freefall were to accelerate over the balance of this week.
Sector/Industry Watch
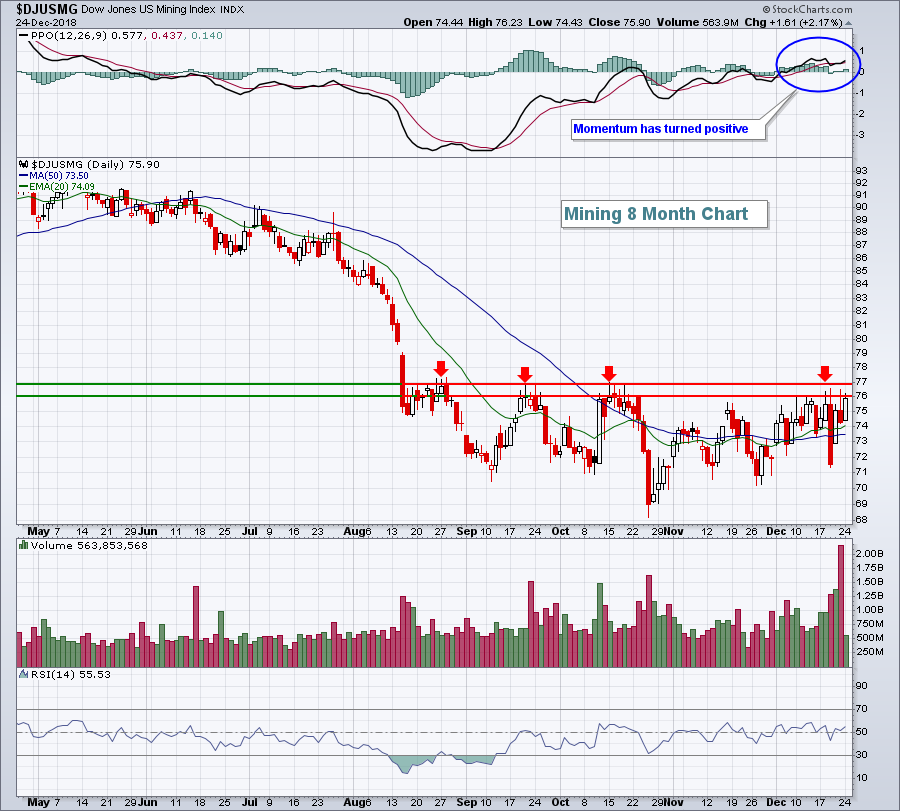
Over the past month, there are only two industry groups with gains - gold mining ($DJUSPM, +7.91%) and mining ($DJUSMG, +5.02%). As the 10 year treasury yield ($TNX) falls, I suspect the U.S. Dollar Index ($USD) will fall right along with it. Given the breakdown in every other industry group, I'd look for further strength ahead in both the DJUSPM and DJUSMG, but the latter looks like it's just getting ready to make a significant break above key price resistance:
 When the U.S. stock market finds a short-term bottom, we'll likely see the DJUSPM and DJUSMG pull back temporarily, but that will set up a better reward to risk entry to hedge against the next stock market decline.
Historical Tendencies
During the last bear market from October 10, 2007 through March 9, 2009, the NASDAQ moved higher 163 days and moved lower 191 days. There are periods of strength as it's typical to see bear market rallies of 10% or more. But the distinction is that they simply don't last. The challenge ahead will be identifying these key pivot points where we should expect further stock market declines.
Key Earnings Reports
None
Key Economic Reports
October Case-Shiller home price index to be released at 9:00am EST: +0.4% (estimate)
Happy trading!
Tom


