Market Recap for Monday, January 14, 2019
The losses on Monday were not huge, but there did seem to be selling in most areas of the market. 10 of 11 sectors finished lower as financials (XLF, +0.69%) was the only sector to finish in positive territory. That sector's strength likely resulted simply from relief - relief that Citigroup (C) didn't warn about 2019. All of our major indices finished lower, led by the more aggressive Russell 2000 and NASDAQ, which dropped 1.01% and 0.94%, respectively. By comparison, the S&P 500 and Dow Jones lost just 0.53% and 0.36%, respectively. Again, the strength in financials masked weakness in other areas. To see the change in market character, from "risk on" to "risk off", check out the Current Outlook section below.
The XLF will have its own obstacles ahead, however, as you can see below:
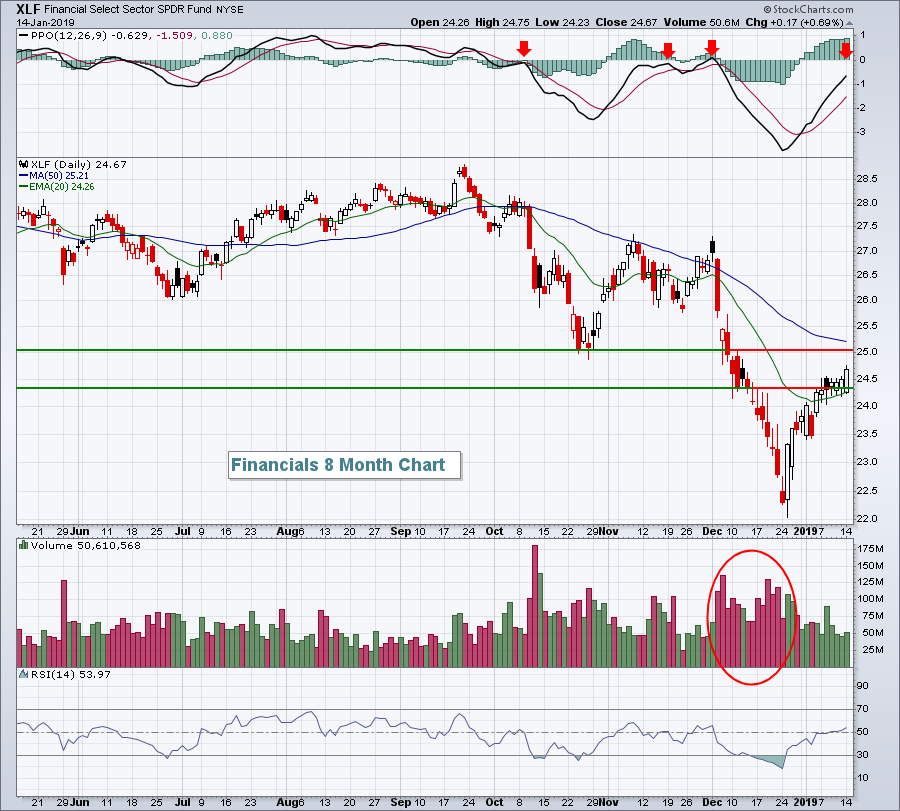 A break above price resistance at 25 and its declining 50 day SMA, currently at 25.21, would provide the bulls a lift, but there's more work left here to do that.
There was plenty of weakness to go around. Utilities (XLU, -2.25%) was easily the weakest sector as PG&E Corp (PCG, -52.36) plummeted following its Chapter 11 bankruptcy announcement. Healthcare (XLV, -1.10%) also had a rough day, thanks in part to a very weak biotechnology group ($DJUSBT, -1.96%). Technology (XLK, -0.93%) also struggled as Apple (AAPL, -1.50%) sellers returned.
Pre-Market Action
JP Morgan (JPM) is the latest company to post disappointing results and/or warn. JPM's EPS came in well short of expectations (1.98 vs 2.20) and their CEO Jaime Dimon suggested that economic growth could shrink to zero if the government shutdown doesn't end soon. The EPS miss was significant as JPM had not missed profit expectations in 15 quarters, or nearly 4 years. If you recall, Apple (AAPL) missed its revenue expectations for the first time in 17 years. These are two companies that tend to be conservative in their guidance and they couldn't meet those conservative estimates. It does underscore the market we're in and illustrates how volatile the U.S. stock market could become over the next few weeks as earnings reports accelerate.
The 10 year treasury yield ($TNX) is down 2 basis points this morning to 2.69%, while crude oil ($WTIC) has jumped back above $51 per barrel, up 1.39% at last check.
Asian markets rallied overnight, while European markets are mixed and anxious, awaiting a critical Brexit vote.
Dow Jones futures are lower by 15 points with 30 minutes left to the opening bell. They are well off their earlier highs and turned lower on the combination of JPM's earnings disappointment and a key miss on the empire state manufacturing survey.
Current Outlook
The following is just one signal, but for the first time since late-December, we saw underperformance by small cap stocks. One day is just one day, but it does signal a shift, even if it's just temporary, from "risk on" to "risk off". Here's a 2 month 60 minute chart to illustrate the change yesterday:
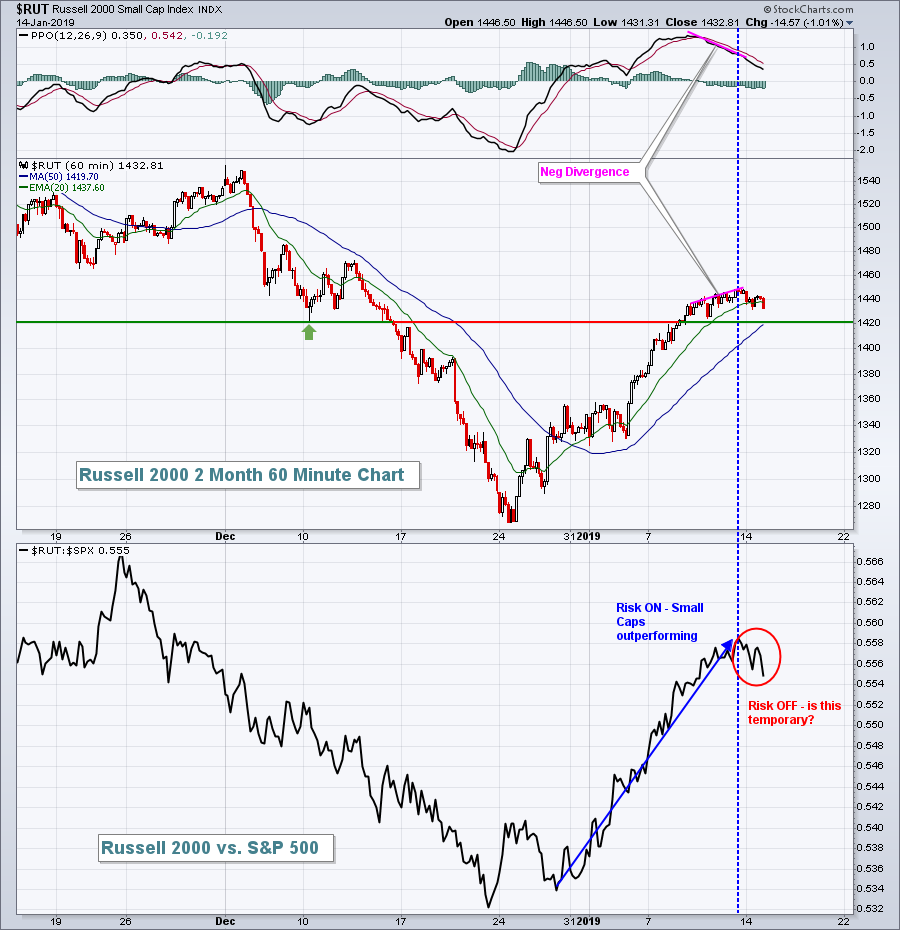 The 60 minute negative divergence would suggest a 50 hour SMA test. Note that the 50 hour SMA resides at 1420, a price point that provided key price support in the second week of December. A breakdown below 1420 and further underperformance by small caps would definitely favor the bearish argument.
Sector/Industry Watch
Banks ($DJUSBK, +1.24%) got a lift from Citigroup's (C, +3.95%) quarterly earnings report on Monday. It actually was a mixed report with revenues (17.1 bil vs 17.6 bil) coming up short, while EPS handily beat expectations (1.61 vs. 1.55). Still, I think it was a relief rally as there wasn't any type of major warning. Banks, like just about every other area of the market, performed poorly in December so traders were likely more concerned with C's guidance than with its latest quarterly results. Despite the strength on Monday, the DJUSBK has trouble ahead technically, as you can see from this weekly chart:
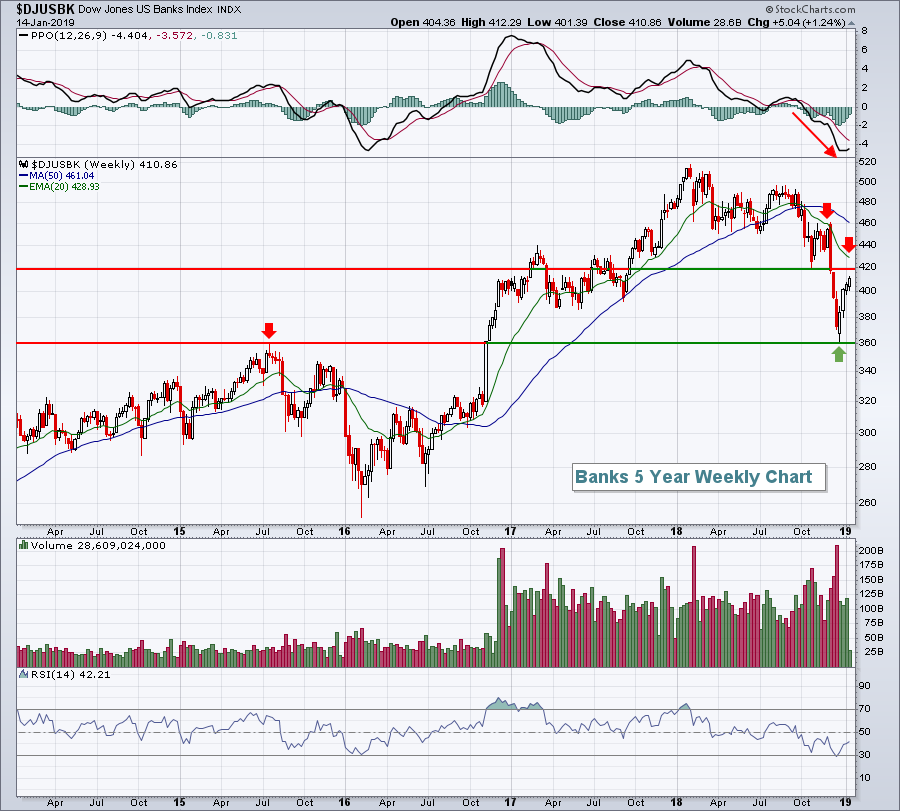 The good news on the chart is that the DJUSBK bounced at 360, which is a very significant long-term price support level. The bad news is that the selling has been extremely heavy on the sell side and much lighter on the rebound. That suggests to me that it will be very difficult for the DJUSBK to clear that 20 week EMA resistance hurdle. Also, last week I provided a daily bank chart showing that overhead price resistance near 420, along with the 50 day SMA, currently at 420 as well.
Historical Tendencies
This Friday (January 18th) marks the end to the best bullish period of the year. Over the past 35 years, the S&P 500 has risen from the October 27th close to the January 18th close 32 times. Currently, the S&P 500 is down roughly 3% during this period with just four trading days left before the period comes to a close.
Key Earnings Reports
(actual vs. estimate):
DAL: 1.30 vs 1.27
FRC: 1.29 vs 1.24
INFO: .57 vs .55
JPM: 1.98 vs 2.20
SNV: .92 vs .94
UNH: 3.28 vs 3.20
WFC: 1.21 vs 1.17
(reports after close, estimate provided):
PNFP: 1.24
UAL: 1.84
Key Economic Reports
December PPI released at 8:30am EST: -0.2% (actual) vs. +0.0% (estimate)
December Core PPI released at 8:30am EST: -0.1% (actual) vs. +0.2% (estimate)
January empire state manufacturing survey released at 8:30am EST: 3.9 (actual) vs. 12.0 (estimate)
Happy trading!
Tom


