Market Recap for Tuesday, January 22, 2019
Energy (XLE, -2.18%), communication services (XLC, -2.07%) and industrials (XLI, -2.07%) all fell more than 2% on Tuesday as Wall Street had its first significant retreat since the day that Apple (AAPL) warned. Late day buying cut into losses as the Dow Jones rebounded from an intraday drop of 462 points to finish down slightly more than 300 points, or 1.22%. Selling was heavier on the NASDAQ, where losses totaled 137 points, or 1.91%. Several headlines were blamed for the drop, including slowing growth in China, the IMF lowering its global growth forecast by one-tenth of a point for each of the next two years, and the lingering government shutdown, which is expected to cut into U.S. GDP. While all of those were likely contributors, I believe the more important reason was of a technical nature. Most of our major indices and sectors are battling overhead 20 week EMAs for the first time since the hefty December decline. Here's the S&P 500:
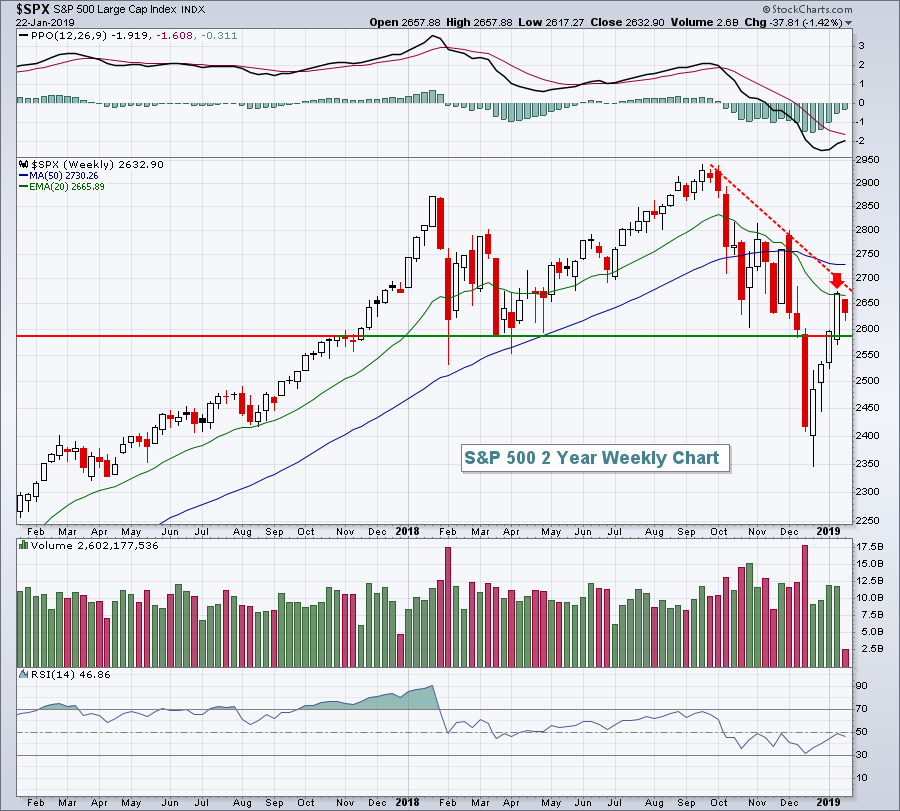 While yesterday's reversal was important for the bears, it really doesn't hurt the bullish view - at least not yet. After all, U.S. indices have move higher nearly uninterrupted since their December 26th low. A bit of profit taking and consolidation is never a bad thing, as long as it remains contained - and that will be the key. The Volatility Index ($VIX) held 16-17 support similar to prior bear markets, so this battle is likely just beginning. From the bulls' perspective, they want to see the rising 20 day EMA hold as support and eventually break above the recent price high and the red-dotted downtrend line shown above. For the bears, it's the opposite. They'll need to hold the line of price and trendline resistance, while counting on another bout of impulsive selling to clear that 20 day EMA support hurdle. The higher VIX is a major ally of the bears.
Two very weak industry groups included commercial vehicles & trucks ($DJUSHR, -3.08%) and semiconductors ($DJUSSC, -2.76%). The former was hurt by both Deere & Co. (DE, -3.51%) and Caterpillar (CAT, -3.19%) falling more than 3%, although the chart on DE has improved greatly in recent weeks:
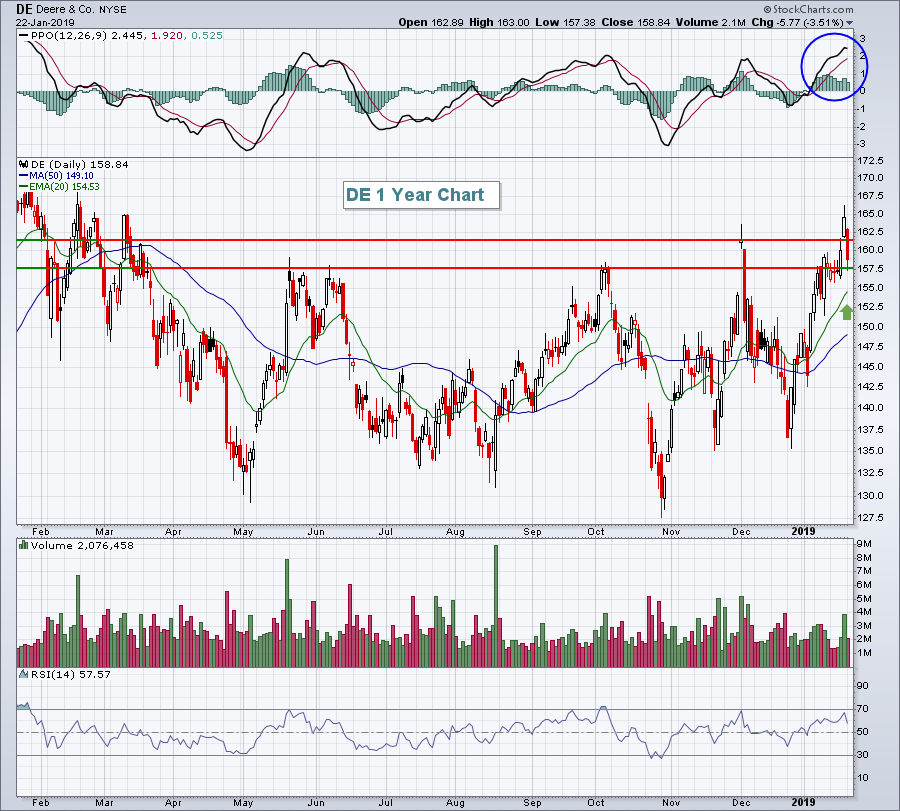 Any stock hitting multi-month highs is an obvious outperformer and DE fits the bill. So long as the rising 20 day EMA holds as support, I'd look for further relative outperformance.
Several key semiconductor components led the decline there. Those dropping roughly 5% or more included Micron Technology (MU, 5.29%), NVIDIA (NVDA, -5.20%), Lam Research (LRCX, -5.19%) and Advanced Micro Devices (AMD, -4.86%)
Pre-Market Action
The 10 year treasury yield ($TNX) is higher by nearly 4 basis points this morning and is back to 2.77%. A break above 2.80% would suggest higher yields ahead, which would likely be bullish for stocks. Crude oil ($WTIC) closed at $53 per barrel on Tuesday and is up fractionally this morning.
Surprisingly, Asian market held up well and were mixed after the U.S. selloff on Tuesday. European markets are also shaking off yesterday's selling episode on Wall Street and are mixed this morning.
U.S. futures suggest continuation of the late day buying from yesterday. The Dow Jones is set to open more than 150 points higher with 30 minutes left to the opening bell. Two solid earnings reports being rewarded this morning include International Business Machines (IBM) and United Technologies (UTX), which are higher by 7.13% and 4.66%, respectively, in pre-market trading. These two are responsible for a great deal of the strength in Dow futures this morning.
Current Outlook
The Volatility Index - CBOE NASDAQ 100 (VXN) bounced right where it needed to Tuesday. This volatility measure had been down nearly every day since December 24th when it topped near 39. The VXN hit recent lows in the 21-22 area when the NASDAQ 100 ($NDX) made significant price tops in November and December. Traders will be watching the VXN, which bounced off support yesterday, to gauge volatility expectations in the days and weeks ahead:
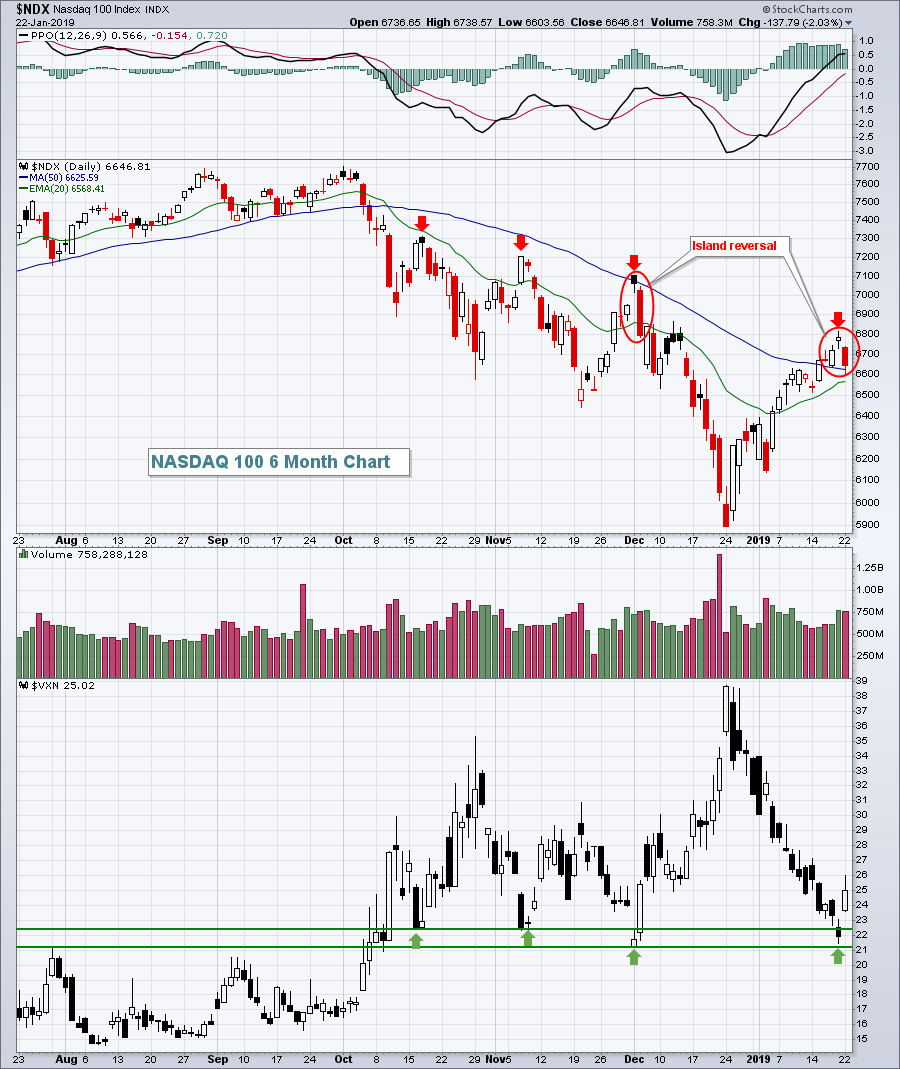 The combination of the VXN bouncing off price support in the 21-22 range and an island reversal printing on the NDX price chart increases the likelihood that we're witnessing a near-term top in the stock market. Obviously, the bulls will want to pierce the Friday price high to negate this topping pattern.
Sector/Industry Watch
As mentioned earlier, the semiconductors ($DJUSSC) had a rough day yesterday and now must negotiate a couple of key earnings reports later today (Texas Instruments - TXN) and tomorrow (Intel - INTC). Short-term technical conditions have definitely improved and the DJUSSC is acting bullishly in the near-term with successful rising 20 day EMA tests:
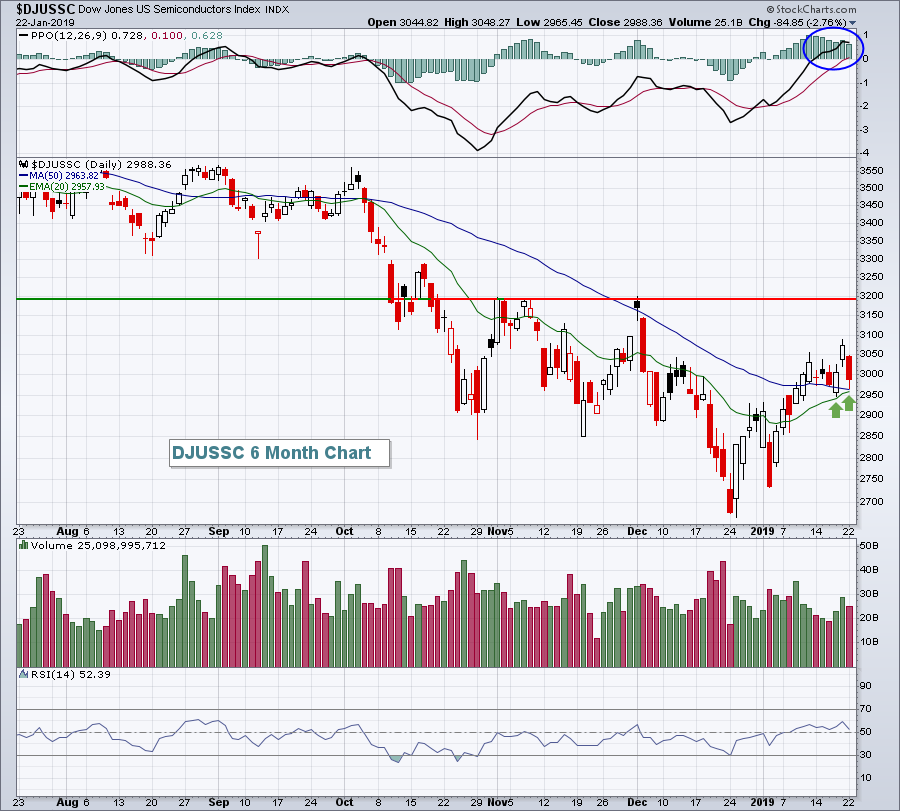 The short-term chart, however, is not the problem. Conditions look pretty good here. The longer-term weekly chart is the problem, not just with semiconductors, but with the overall market as a whole. Here's the weekly chart for the DJUSSC:
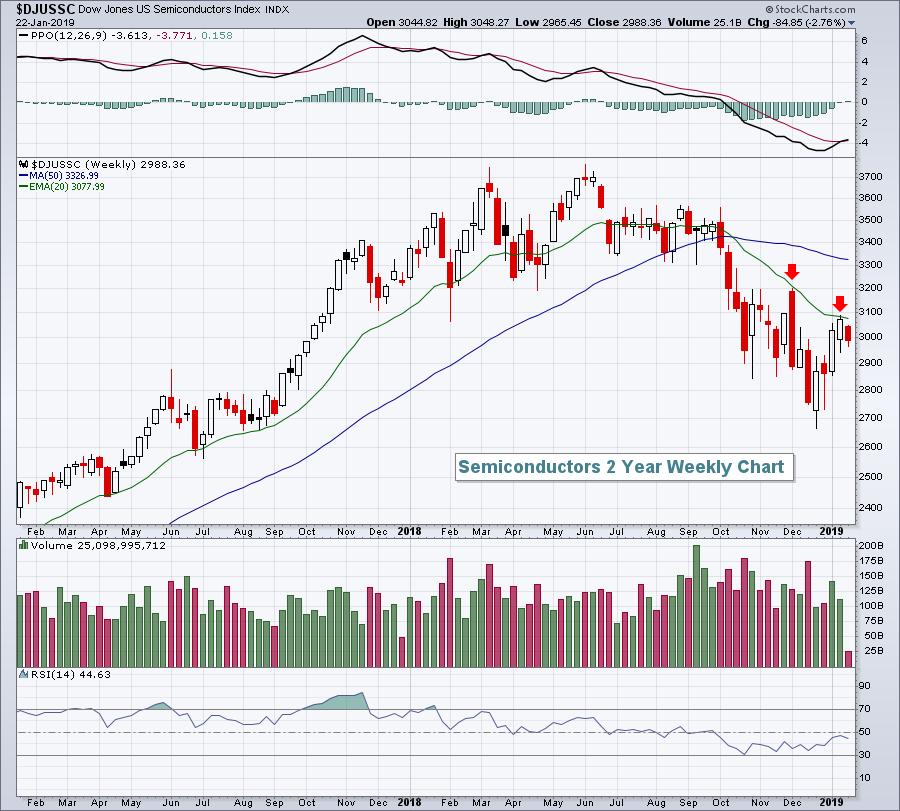 Thus far, the DJUSSC has not been able to negotiate the declining 20 week EMA. It's had two opportunities and two failures. Until more and more areas of the market can clear this important moving average resistance, we'll see bears encouraged to keep selling.
Historical Tendencies
Skechers (SKX) loves the first four months of the calendar year. Here are its average monthly returns over the past two decades:
January: +5.7%
February: +7.3%
March: +4.7%
April: +13.7%
That totals +31.4%. The remaining 8 months combined have produced, on average, just +0.7%.
Key Earnings Reports
(actual vs. estimate):
ABT: .81 vs .81
APH: 1.05 vs .98
ASML: 2.12 vs 2.04
CMCSA: .64 vs .62
KMB: 1.60 vs 1.68
PG: 1.25 vs 1.21
PGR: 1.01 - estimate, awaiting results
TEL: 1.29 vs 1.26
UTX: 1.95 vs 1.51
(reports after close, estimate provided):
CCI: 1.44
CP: 3.18
F: .31
LRCX: 3.67
LVS: .86
TXN: 1.24
XLNX: .85
Key Economic Reports
November FHFA house price index to be released at 9:00am EST: +0.3% (estimate)
Happy trading!
Tom


