Market Recap for Wednesday, January 16, 2019
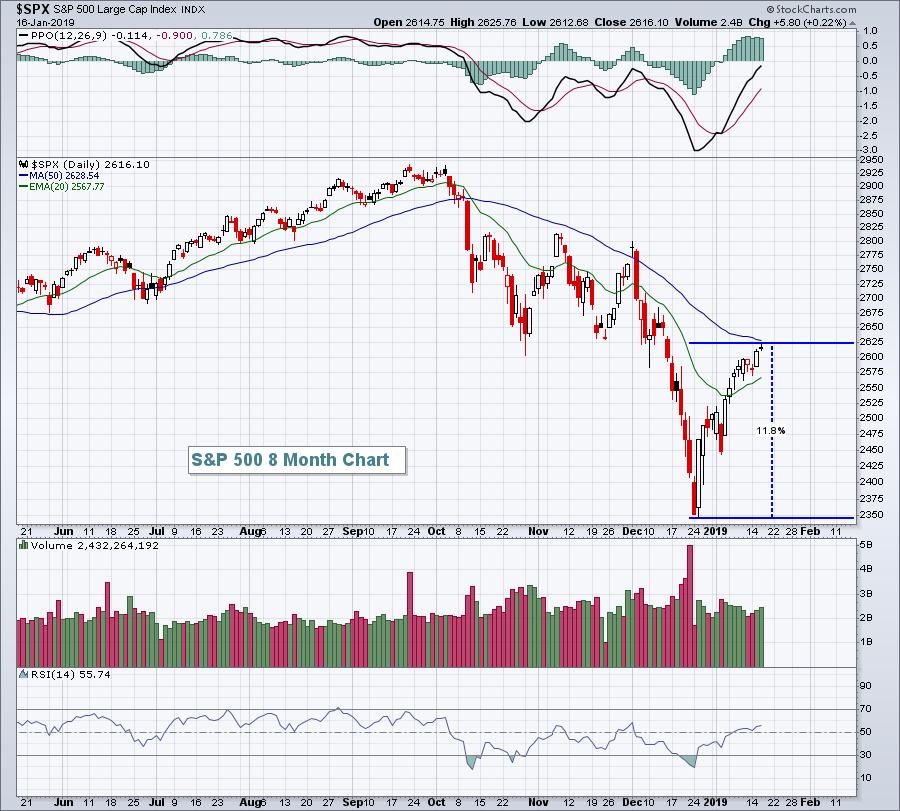
Late-day selling cut into some of Wall Street's gains, but the bear market rally continued. It's left many wondering whether we're still in a bear market. The technical answer to that question is yes, we're in a bear market until we see a rally of 20%. The S&P 500 has rallied close to 12% off the bottom, so there's still a long way to go:
 There have been a number of reasons for the rally, with the most obvious being that we were simply way oversold and needed a bounce. The daily RSI in the chart above is now into the mid-50s and the 50-60 range typically provides momentum resistance in a downtrend. Therefore, we should be on the watch for a potential reversal at any time.
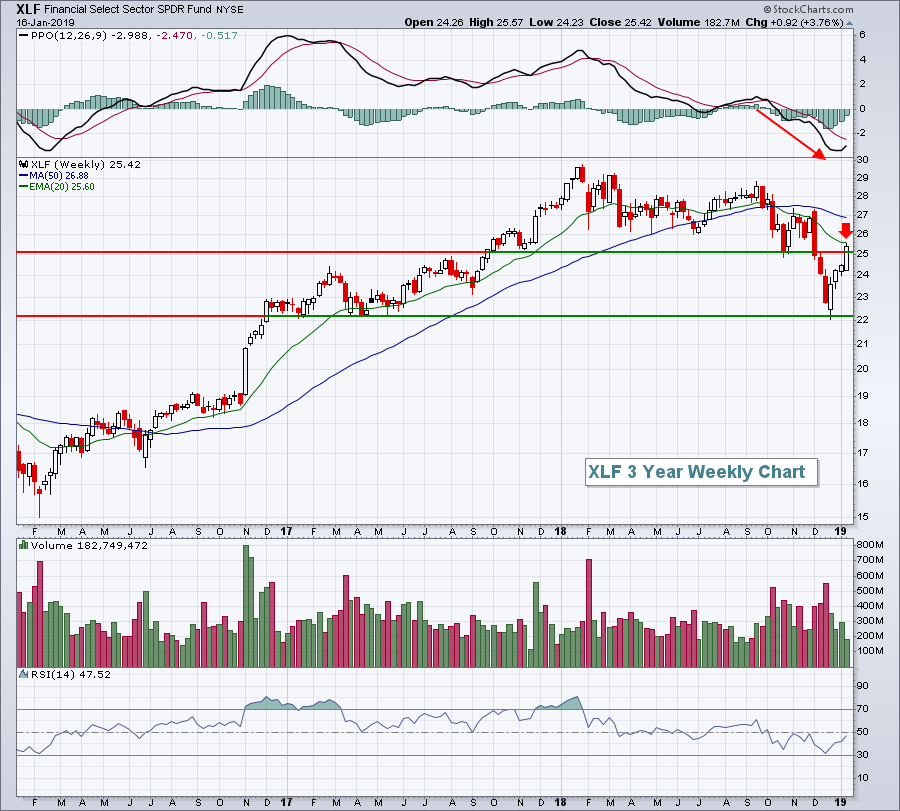
But for at least one more day, the bulls were in charge and financials (XLF, +2.13%) were the reason. Bank of America (BAC, +7.16%) and Goldman Sachs (GS, +9.54%) reported quarterly results that came in ahead of expectations and traders pounced on both stocks as they had been tortured during the Q4 market meltdown. Despite the impressive 4% gain over the past week, the XLF still has underperformed over the past three months and is just now testing overhead 20 week EMA resistance, a major level of resistance in a bear market:
 The lighter volume accompanying the rally and failure thus far at the declining 20 week EMA gives me reason to pause regarding the current bull market rally, but until we begin seeing price breakdowns, it's difficult to get aggressively short. If you do short, I'd pay close attention to 20 week EMAs. Those represent solid reward to risk entry points on the short side.
Other strength yesterday included real estate (XLRE, +0.47%), materials (XLB, +0.36%), and utilities (XLU, +0.36%). Notably absent from Wednesday's rally were the consumer sectors - staples (XLP, -0.54%) and discretionary (XLY, -0.23%).
Pre-Market Action
One day after Goldman Sachs (GS) soared on its quarterly earnings, we see the unpredictability of this earnings season. This morning, Morgan Stanley (MS) missed its earnings estimate by a mile (.73 vs .90) and the stock is down 4% in pre-market trading. So a group - investment services ($DJUSSB) - that was a leader on Wednesday may find itself under significant pressure today. Let's see how traders react to the MS miss after the opening bell rings.
Crude oil ($WTIC) is down close to 2% this morning, while both gold ($GOLD) and the 10 year treasury yield ($TNX) are relatively flat. Asian markets were mostly lower overnight, and European markets are following suit this morning. Currently, Dow Jones futures are down 57 points with a little more than 30 minutes left to the opening bell.
Current Outlook
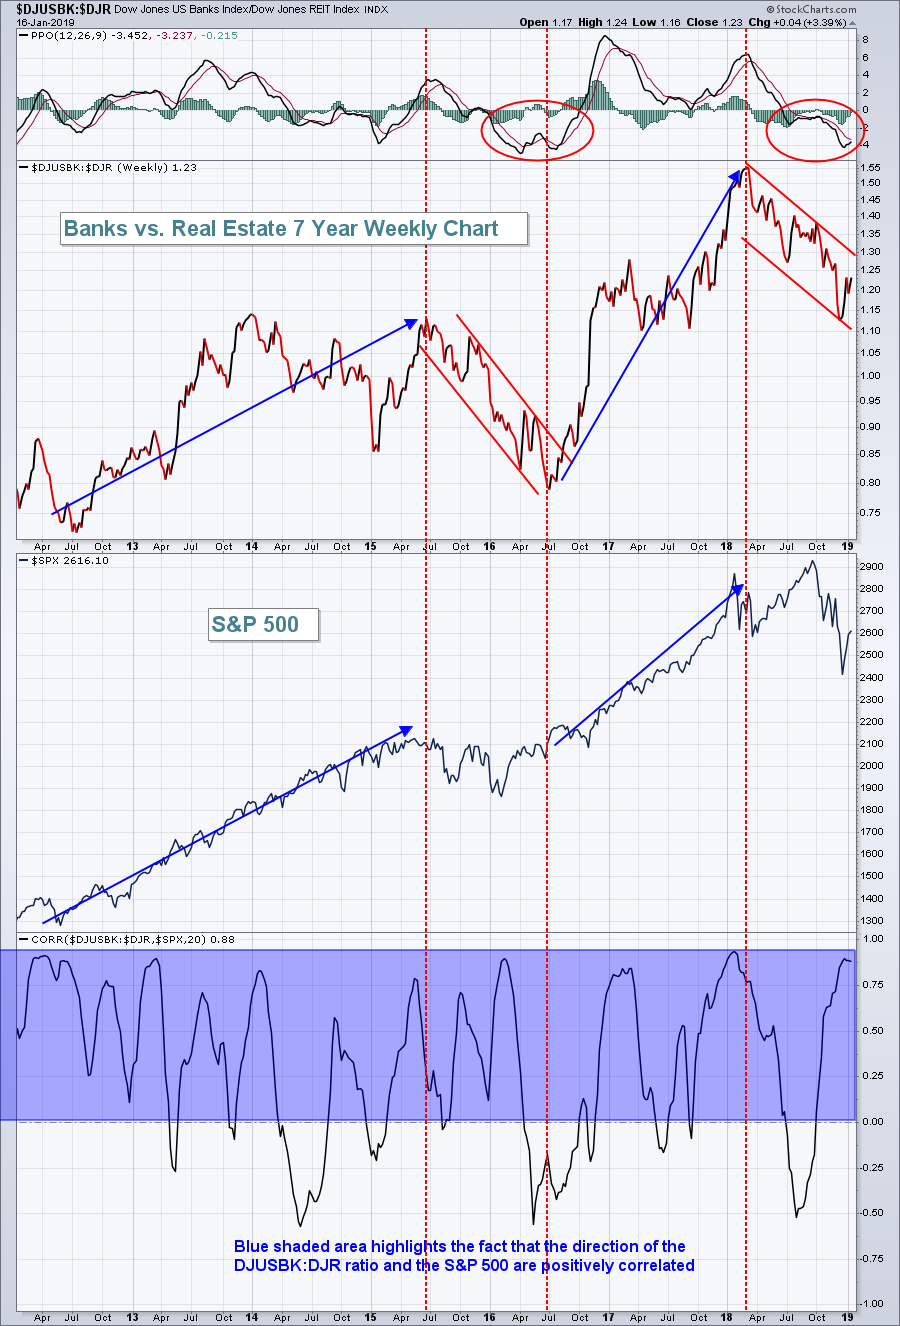
I've discussed several intermarket relationships that I watch to help determine/predict the direction of U.S. stocks. One that I rarely discuss is the relationship between banks ($DJUSBK) and real estate ($DJR). Both of these used to be included in the financial sector, but the latter now has its own sector. Previously, however, viewing the relationship between the more aggressive and more economically-sensitive banks and the more defensive real estate group provided market directional clues as the correlation between their relative performance and the benchmark S&P 500's performance was eye-opening. The DJUSBK:DJR relative ratio shows a strong positive correlation with the direction of the S&P 500, as illustrated below:
 Over the past 7 years, the correlation between the direction of the DJUSBK:DJR ratio and the S&P 500 has been quite positive. The problem currently, however, is that the DJUSBK:DJR ratio remains in a downtrend that began in early 2018. Until this ratio reverses higher, the likelihood of the bull market resumption is unlikely at best. We have seen the ratio turn higher during the current market rally, but the bigger picture downtrend remains in play and that is a concern for the bulls.
Sector/Industry Watch
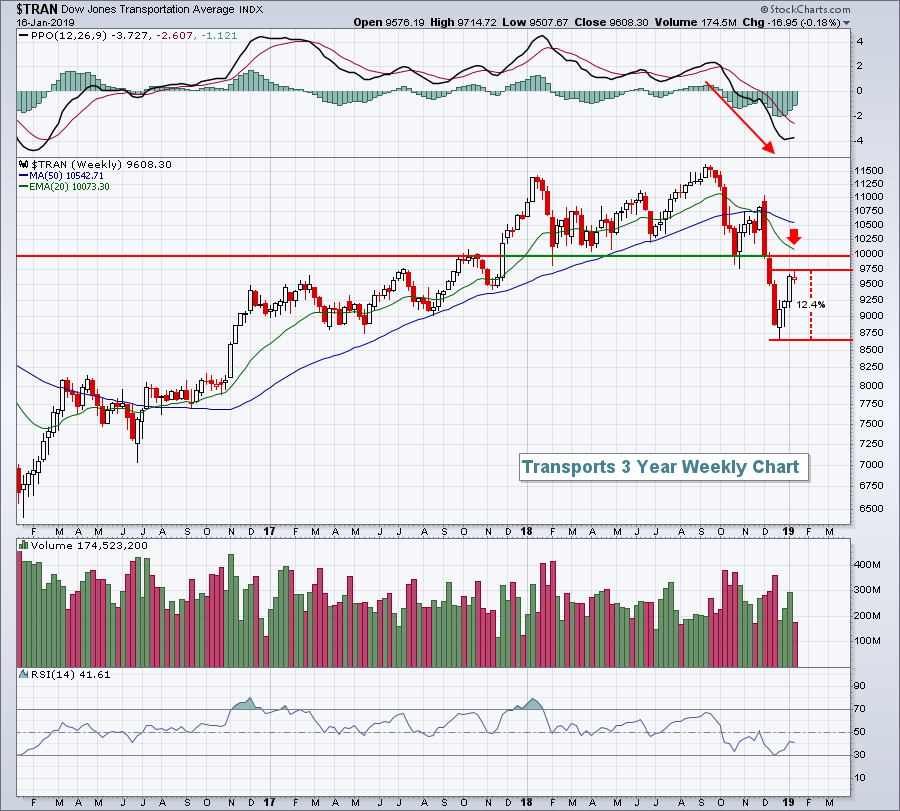
Transports ($TRAN), like most areas, have bounced but unfortunately still remain well beneath their declining 20 week EMA. Price resistance resides closer to 10000 and its 20 week EMA is at 10073. Here's a current look at the chart:
 Transports were due for a bounce as their weekly RSI touched 30 in December and they've received it. The fact that their weekly RSI hit 30, however, is problematic as we rarely see that type of weekly RSI reading in a bull market. This chart suggests we'll see further stock market weakness ahead.
Historical Tendencies
The January Effect is a phenomenon that suggests "as goes January, so goes the rest of the year". Clearly, we're off to a great start in January. While there have been disappointments in the past where January has not been a great predictor, there's undeniable historical proof that ties strong January performance to even stronger performance later in the year. The S&P 500 is currently up 4.18% in January 2019. I break down historical January performance (dating back to 1971 on the NASDAQ) into four quadrants - the top 25% of Januarys, the second 25%, third 25% and the bottom 25%. At 4.18%, the January 2019 performance would fit into that second quadrant. Average "balance of year" returns (not including January) have averaged roughly 13% in the past.
Key Earnings Reports
(actual vs. estimate):
BBT: 1.05 vs 1.04
CBSH: .96 vs .95
FAST: .60 vs .60
KEY: .48 vs .47
MS: .73 vs .90
MTB: 3.79 vs 3.51
PPG: 1.15 vs 1.09
TSM: .63 (estimate, still awaiting comparable number in US$)
(reports after close, estimate provided):
AXP: 1.80
JBHT: 1.48
NFLX: .24
TEAM: .21
Key Economic Reports
December housing starts released at 8:30am EST: 1,256,000 (estimate)
December building permits released at 8:30am EST: 1,293,000 (estimate)
Initial jobless claims released at 8:30am EST: 213,000 (actual) vs. 221,000 (estimate)
January Philadelphia Fed survey released at 8:30am EST: 17.0 (actual) vs 10.0 (estimate)
Happy trading!
Tom


