Market Recap for Friday, January 25, 2019
Our major indices rallied strongly on Friday, with 9 of 11 sectors rising to support the move. Only two defensive sectors - utilities (XLU, -1.37%) and consumer staples (XLP, -0.40%) failed to participate in the advance. Leading the charge was materials (XLB, +1.90%) as a weak U.S. dollar ($USD, -0.86%) encouraged traders to buy the technically-improving materials group. Gold ($GOLD, +1.43%) benefited from the dollar's weakness and that relationship is examined in more detail in the Sector/Industry Watch section below.
The strength on Friday enabled many of our major indices and sectors to approach, test, or slightly pierce key 20 week EMAs. The benchmark S&P 500 is a perfect example of this test (red arrow below):
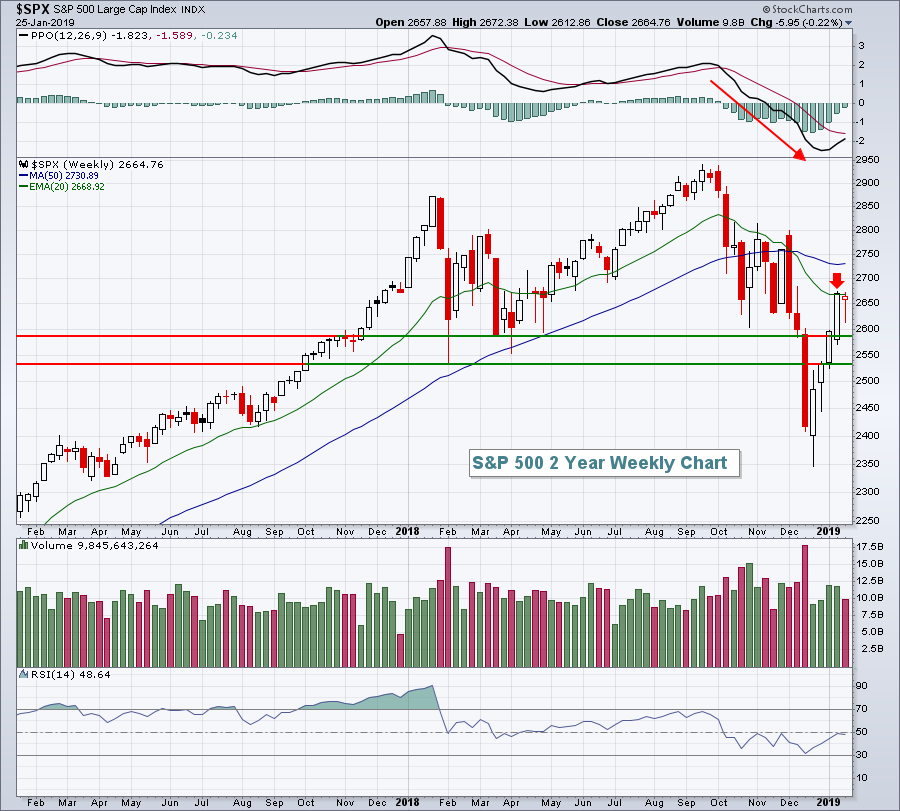 During periods of downtrending price action, weekly PPOs tend to remain negative, weekly RSIs typically top in the 50-60 range and overhead 20 week EMAs provide critical resistance. Despite all the strength off the December low, these three bearish traits remain intact. The bulls' worries are not over. Thus far, the bulls have been incredibly resilient and that's a good sign, but more tests remain. This morning, a warning from Caterpillar (CAT) will likely test the bulls' mettle once again.
Technology (XLK, +1.42%) strengthened behind computer hardware's ($DJUSCR, +3.29%) push higher. While the strength is certainly nice and the breakout above the prior two tops is a step in the right direction, issues remain. Namely, Apple, Inc (AAPL) is near its overhead gap resistance from earnings and that complicates the recovery attempt in its industry. Here's the chart:
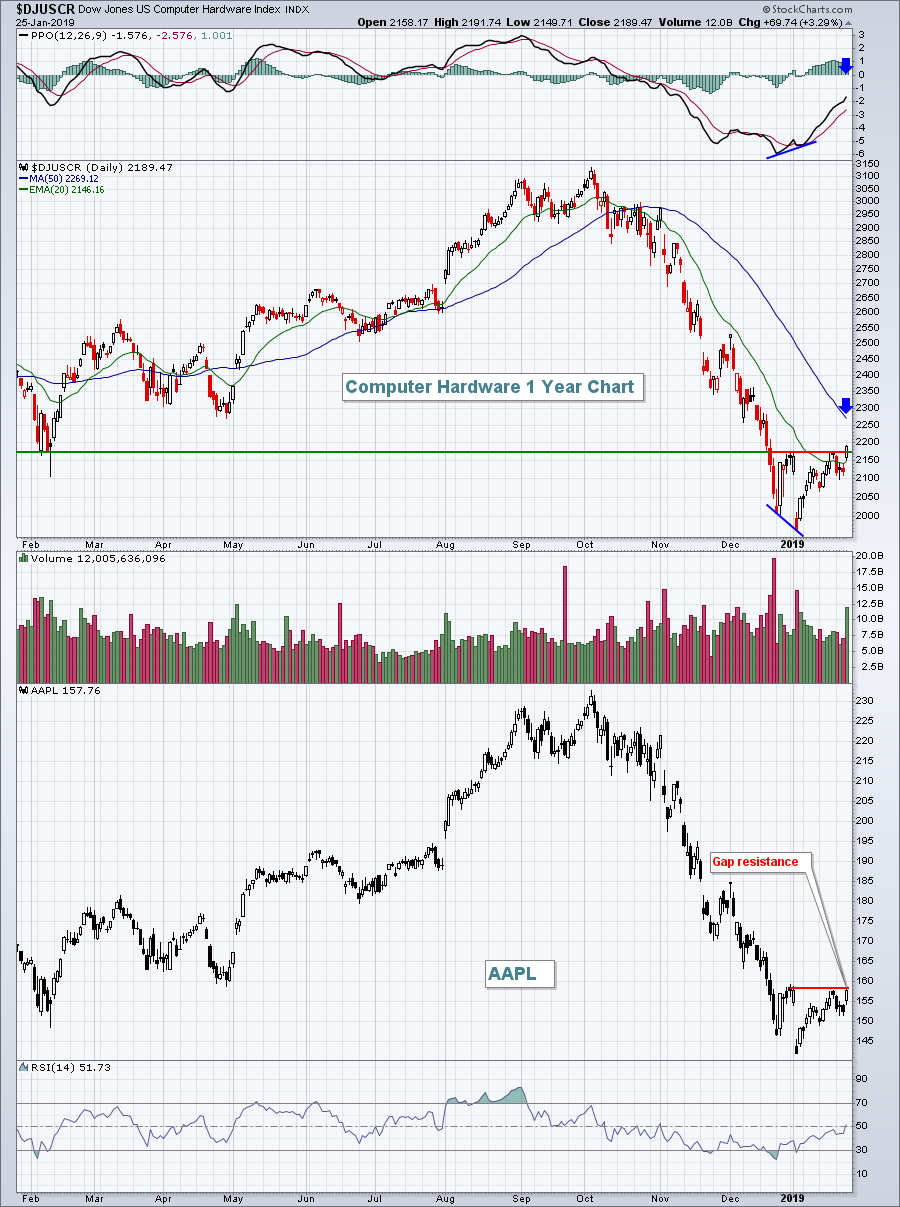 I think we all understand the impact that AAPL has on technology and our major indices, so whether or not AAPL can continue its ascent will have significant influence on the U.S. equity market.
Pre-Market Action
Caterpillar (CAT) is down more than 5% in pre-market action after reporting EPS well below expectations. CAT also lowered its 2019 profit forecast and its share price weakness is weighing on Dow Jones futures. Dow futures are lower by 200 points with roughly 30 minutes left until the opening bell.
Asian markets were mixed overnight, while European markets are fractionally lower. Crude oil ($WTIC) continues to trade in a range between $50-$54 per barrel and gold ($GOLD) trades just below $1300 per ounce.
Current Outlook
Financials (XLF) will be worth watching today as the tail and false breakout on Friday could be meaningful. Currently, I'd view that as a short-term top with rising 20 day EMA as key support. Let's see which is broken first, resistance or support:
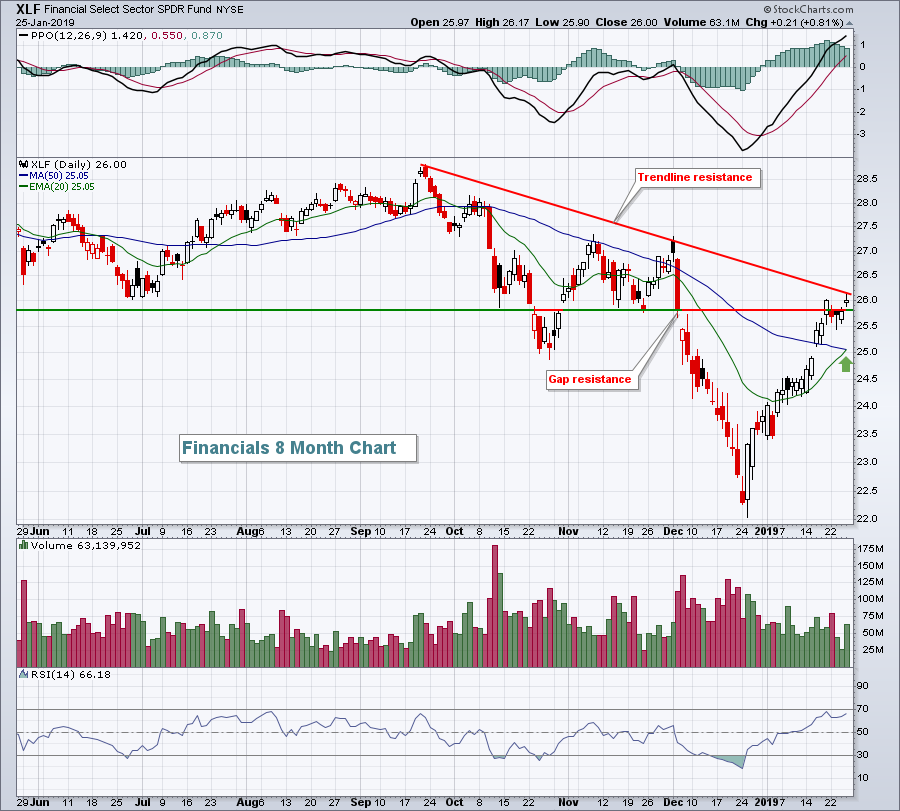 The XLF cleared gap resistance nicely, but touched the downtrend line formed by the ultimate high in September and the double-top high to start December. It's also important to note that the XLF has cleared its 20 week EMA so another push through the trendline resistance would be particularly bullish. Those in the bearish camp really would like to see the Friday candle turn out to be the January top as the XLF rolls back beneath its 20 week EMA, currently at 25.68.
Sector/Industry Watch
The U.S. Dollar Index ($USD) was weak last week and that aided gold's ($GOLD) continuing rally. Both, however, are nearing significant hurdles that I expect to be tested:
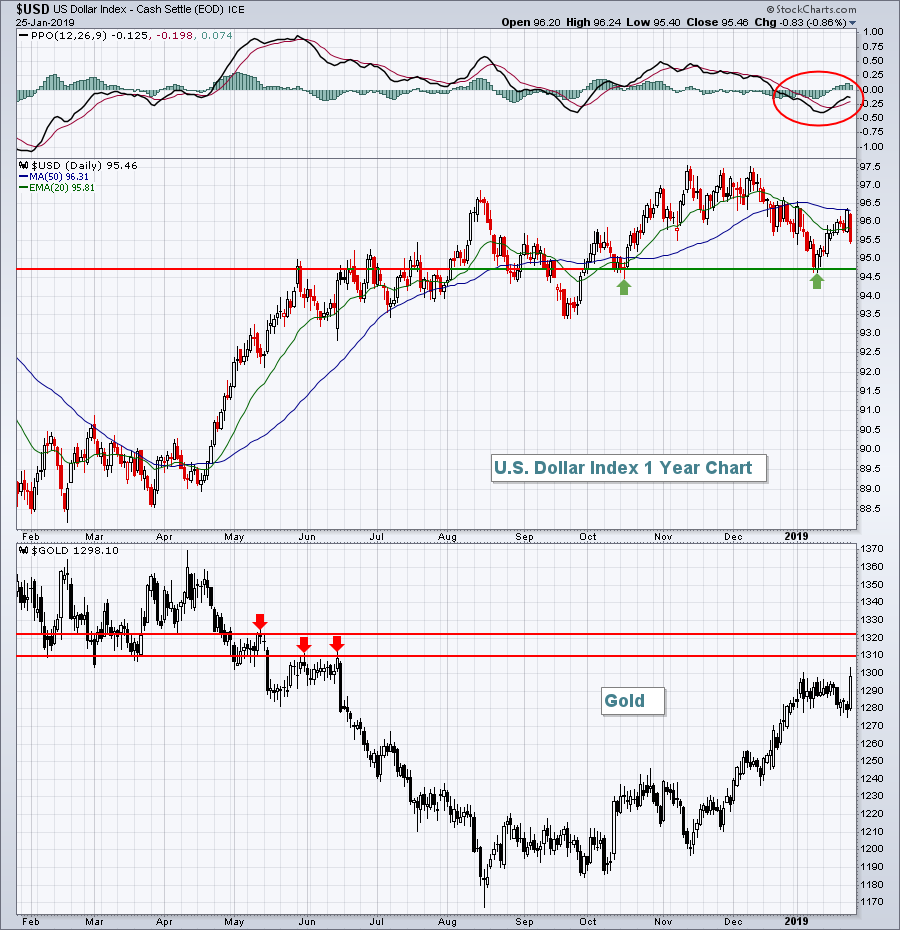 The daily PPO shows that sellers of the dollar remain in control and we appear to be rolling over again with last week's weakness. That quickly enabled GOLD to rally back to the $1300 per ounce level. I expect the USD to falter a bit more before regaining strength. If that's the case, look for GOLD to test overhead resistance near $1320. Should the U.S. equity market begin falling again, we could see GOLD pierce that $1320 level and head for a much more significant intermediate-term price test closer to $1360-$1370.
The dollar's weakness propelled material stocks higher on Friday. Expect that relative outperformance by materials to continue if the dollar moves lower to test price support in the 94.50-94.75 area.
Monday Setups
Given that our major indices remain mostly beneath 20 week EMAs, I'm going to stick with another trade on the short side. CommScope, Inc. (COMM) has been trading better - above its 20 day EMA, but it continues to lag the overall market and its peers:
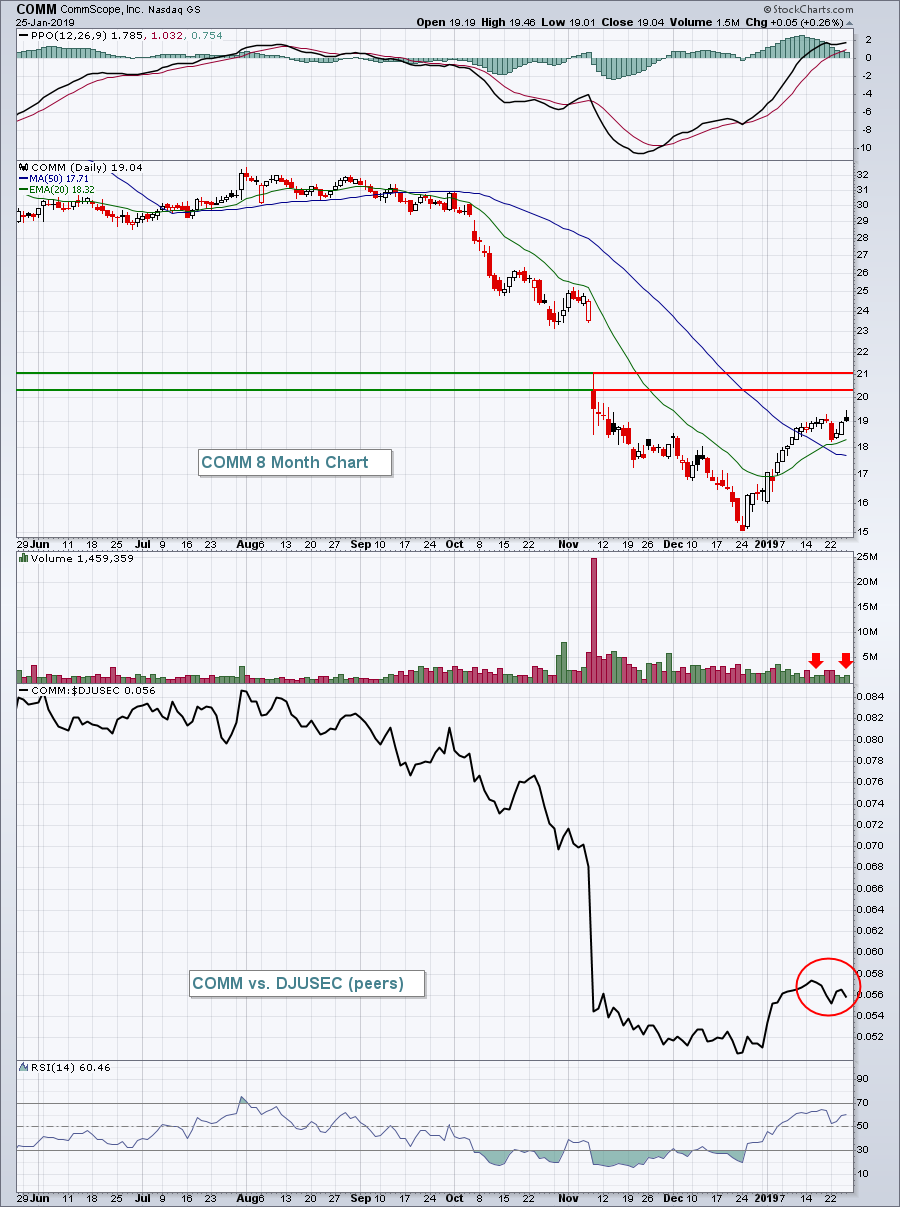 COMM gapped lower on extremely heavy volume after its latest quarterly earnings report. It has since rallied like the overall market, but its relative strength has already begun weakening again (red circle). Also, the volume on its most recent rally attempts has been lacking. The 20.25-21.00 area would provide the best reward to risk short entry, but COMM may not get there, especially if our major indices begin to weaken. I could see another shoe dropping and, minimally, a retest occurring at the recent low near 15. A close above 21.25, especially on increasing volume, should be respected.
Historical Tendencies
Humana, Inc. (HUM) has an interesting history over the past two decades. HUM has averaged gaining 26% per year over that span, but February and March are the only two months where HUM shows negative average returns:
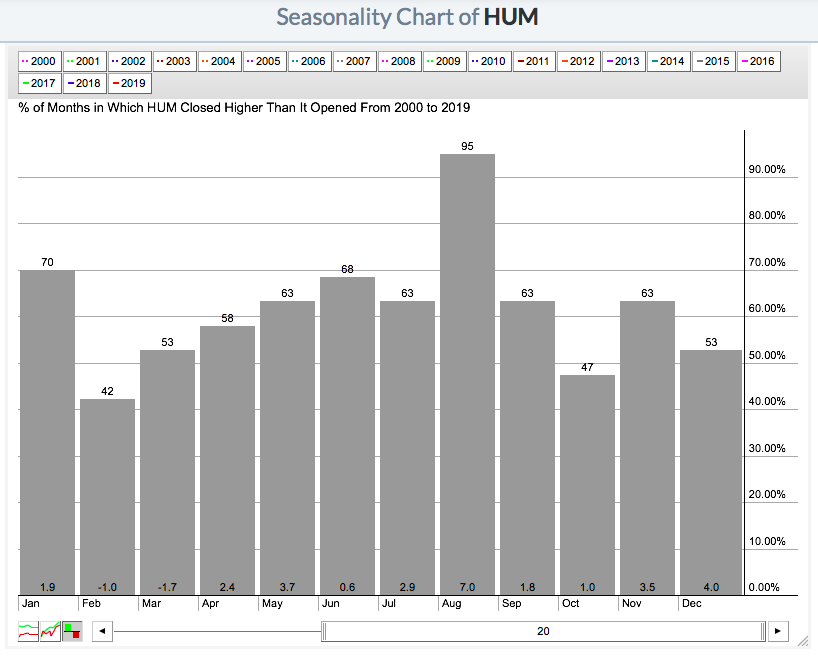
Those average monthly returns of -1.0% and -1.7% for February and March, respectively, really stick out compared to strength shown throughout the balance of the calendar year. It's certainly no guarantee that HUM will move lower in February and March of this year, but it adds to the bearish case. The technical picture should always be our primary indicator, but simply keep in mind HUM's historical tendencies.
Key Earnings Reports
(actual vs. estimate):
CAT: 1.78 vs 2.98
(reports after close, estimate provided):
BRO: .27
CE: 2.42
ELS: .97
GGG: .43
IDTI: .46
RGA: 3.39
WHR: 4.30
Key Economic Reports
None
Happy trading!
Tom


