Market Recap for Monday, January 28, 2019
It seemed like the bears let a perfect opportunity slip right through their fingers yesterday. Caterpillar (CAT, -9.13%) reported their latest quarterly earnings before the bell and they weren't pretty. Despite beating revenue estimates, CAT posted EPS well below estimates ($1.78 vs $2.98) and then warned about 2019 because of China concerns. If that wasn't enough, NVIDIA Corp. (NVDA, -13.82%) warned just before the opening bell, saying its quarterly revenues would be just $2.2 billion, well below the $2.7 billion that Wall Street was expecting. The charts were suggesting more bad news from NVDA, however, as the following clearly reflects:
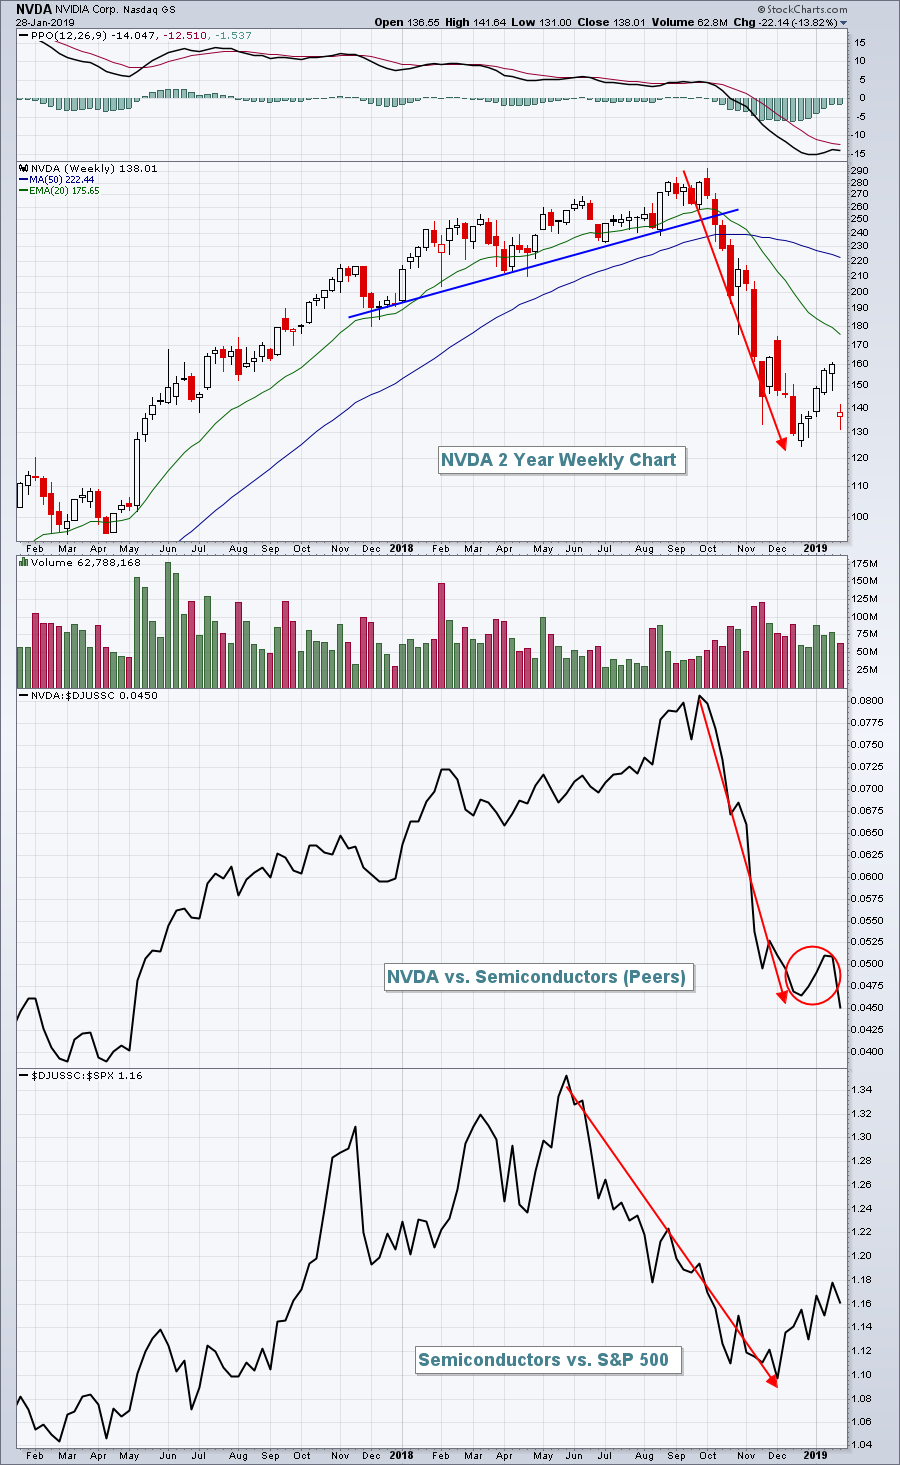 Several clues appear on this NVDA chart. The bottom part of the chart shows that semiconductors lost their relative strength vs. the benchmark S&P 500 during the second half of 2018. Money had already begun rotating away from this influential technology group. In Q4, NVDA began underperforming its peers in the semiconductor space in a big, big way. So think about it. Money was rotating away from semiconductors and NVDA was being shunned within the group. Why would that happen? Well, Wall Street firms clearly had visited NVDA management and already knew the poor results were coming. That's why NVDA has been underperforming. It's a very simple case of technical price action preceding fundamental news. Those who believe that technical analysis doesn't work needs to study NVDA's chart for a bit.
As you might expect, technology (XLK, -1.33%) was the worst performing sector and led lower by semiconductors ($DJUSSC, -2.28%). The only two sectors that were able to avoid the Monday selling were real estate (XLRE, +1.00%) and consumer staples (XLP, +0.43%).
Our major indices tumbled at Monday's open with the CAT and NVDA headline news, but more tough political talk on both sides also continues to wear on traders' nerves. It also didn't help that biotechs ($DJUSBT, -2.08%) were driving healthcare (XLV, -1.14%) lower. Throw in the worst day in weeks for crude oil prices ($WTIC, -3.17%) and energy (XLE, -1.00%) shares falling and we had a number of puzzle pieces stringing a bad day together.
Pre-Market Action
We're seeing mixed results and guidance, but the bulls have been showing their resiliency. Monday was a perfect example. Today is a new day and Dow Jones futures are pointing to early gains of approximately 70 points with 30 minutes left to the opening bell.
Gold ($GOLD) cleared the $1300 per ounce level yesterday and is trading up another $3 today. Meanwhile, the U.S. futures are likely being aided by strength in Europe. Asian markets were mixed overnight.
Current Outlook
The good news for the bulls is that defensive areas of the stock market have been taking a back seat to the more aggressive areas. If you recall, the massive drop in the 10 year treasury yield ($TNX) began in November, a full month before equities topped to begin December. That highlighted the rotation from aggressive equities to defensive treasuries before the big selling began in equities. From a sector perspective, we can look for the same thing. Utilities (XLU), consumer staples (XLP), real estate (XLRE) and healthcare (XLV) are the more defensive-oriented sectors that outperform when traders/investors are in a "risk off" mode. Currently, these defensive sectors (excluding XLRE) are underperforming as the S&P 500 pushes higher. For the market to truly implode and perhaps begin a trek that results in a double bottom (or worse), we'll need to see traders become more defensive. Here's a chart to watch:
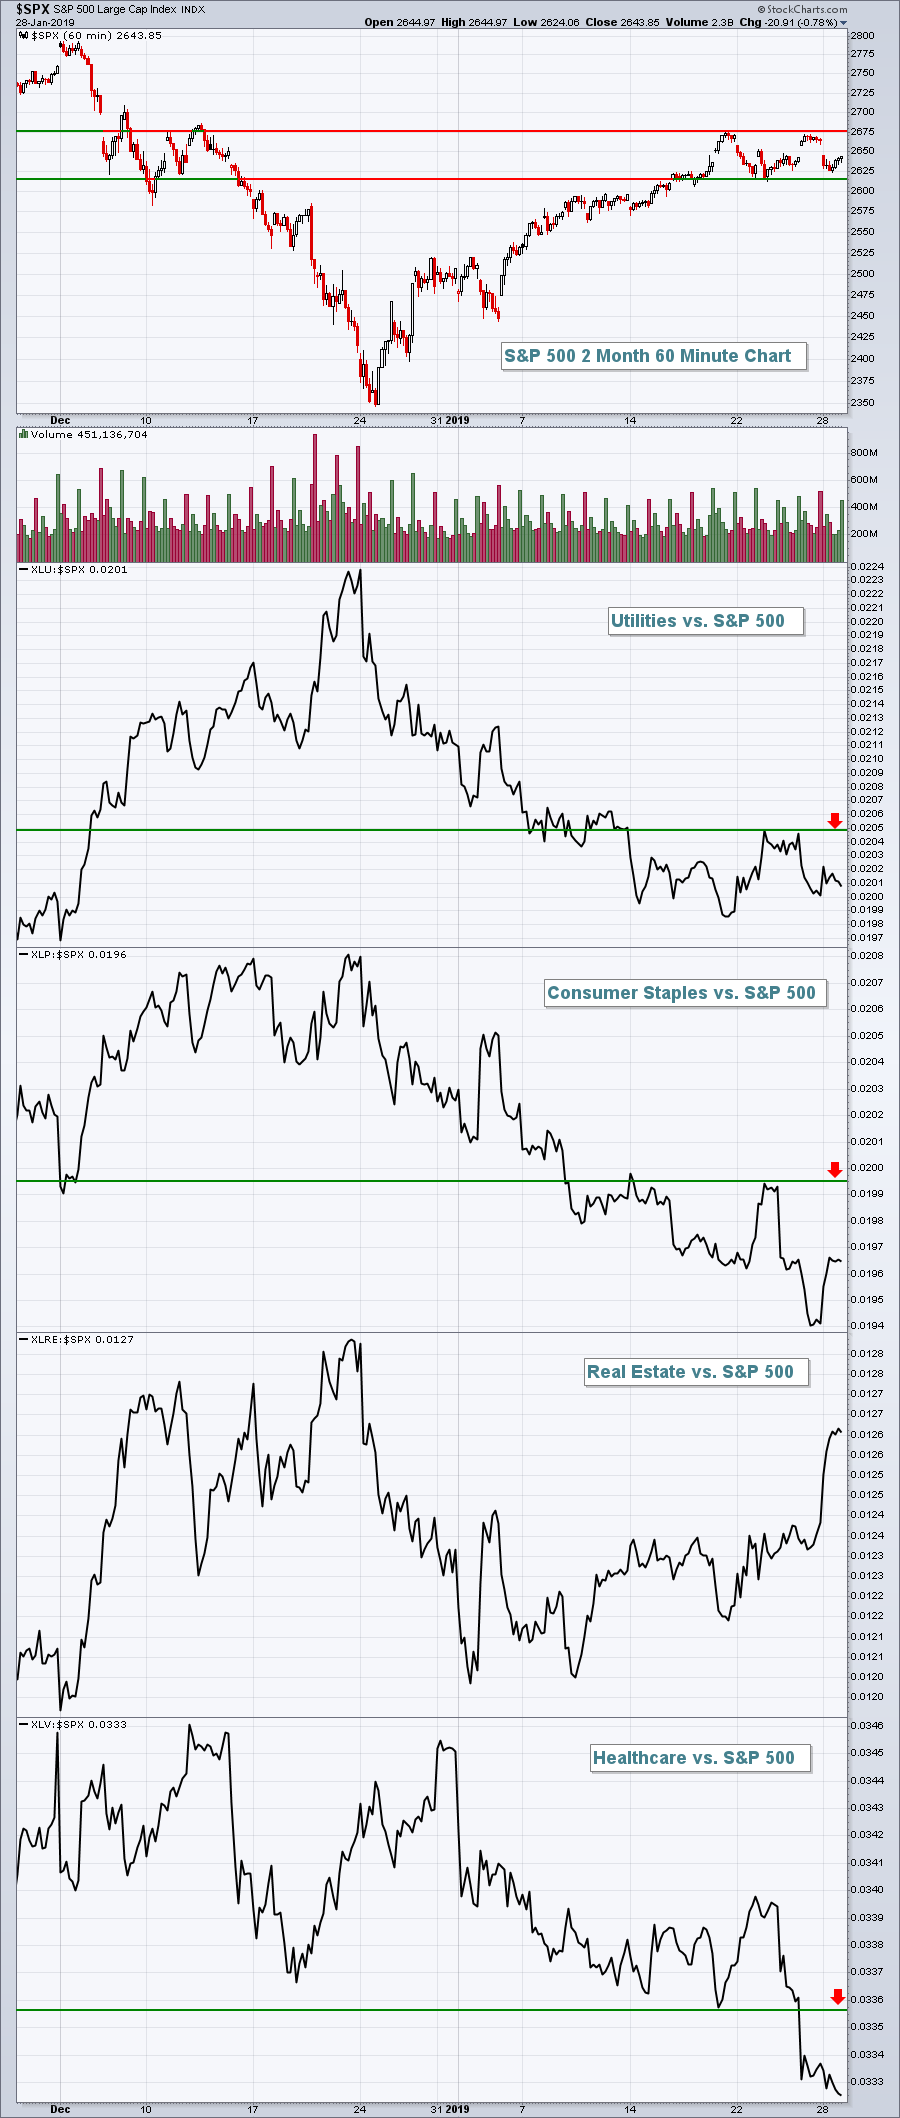 These sectors should be uptrending on a relative basis, signaling that traders seek out safety, in order for more sellers to arrive to drive equity prices lower. Right now, the bulls remain in charge.
Sector/Industry Watch
I mentioned biotechs ($DJUSBT) earlier. Their bear market rally had been quite impressive, but once overhead price resistance from early December was reached, it's been all downhill:
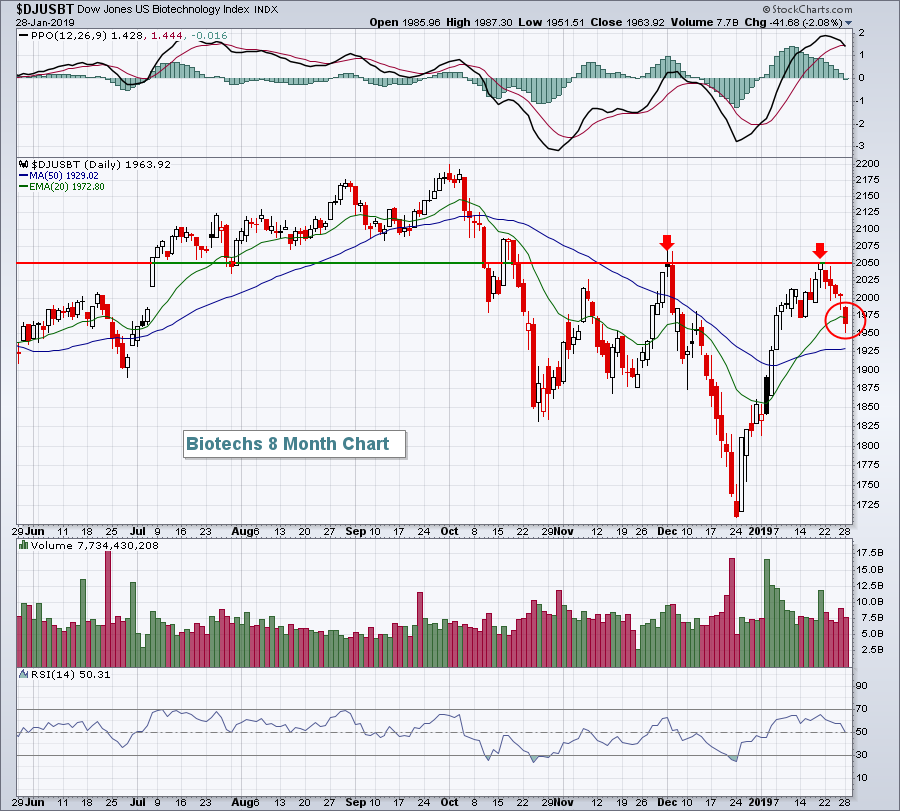 Biotechs could use a rally, and sooner rather than later. Yesterday's close was beneath the low close from two weeks ago and it was also the first close beneath the rising 20 day EMA (red circle) since it cleared that key moving average to open 2019. The double top (red arrows) is significant as it clearly marks the major price resistance level. An eventual breakout there would be extremely bullish. But first we need to see if the DJUSBT can climb back above its 20 day EMA and hold there.
Historical Tendencies
Among S&P 500 companies, the following two companies represent the best and the worst as far as February performance goes:
Best:
Regeneron Pharmaceuticals (REGN) - has averaged gaining 16.8% during February over the past 20 years. This is very misleading, however, as REGN soared in February 2000 from roughly 12.50 to 60.00. REGN actually has averaged losing 2.2% over the past 19 years and has only risen 28% of Februarys over that span. My point? Sometimes you need to use some common sense when evaluating seasonality. For instance, while REGN showed an average gain of 16.8% during February over the past 20 years, it only rose during Februarys 32% of the time. In addition to a high average return, there should also be a very strong track record in terms of % times a month moves higher.
Using the above criteria, Booking Holdings (BKNG) should be viewed as the best S&P 500 performer in February. BKNG has risen 84% of Februarys and has posted an average February return of +8.6% over the past 20 year span.
Worst:
Equinix Inc. (EQIX) - has averaged losing 5.8% during February over the past 20 years.
Key Earnings Reports
(actual vs. estimate):
AGN: 4.29 vs 4.15
BIIB: 6.99 vs 6.72
DHR: 1.28 vs 1.27
GLW: .59 vs .57
HCA: 2.59 (estimate, still awaiting results)
HRS: 1.96 vs 1.91
LLL: 3.10 vs 2.66
LMT: 4.39 vs 4.39
MMM: 2.31 vs 2.27
PCAR: 1.65 vs 1.57
PFE: .64 vs .63
ROK: 2.21 vs 1.98
SAP: 1.72 vs 1.78
VZ: 1.12 vs 1.09
(reports after close, estimate provided):
AAPL: 4.17
ALGN: 1.16
AMD: .09
AMGN: 3.26
BXP: 1.68
CNI: 1.11
EBAY: .68
EQR: .85
ILMN: 1.36
JNPR: .57
KLAC: 2.20
SYK: 2.15
Key Economic Reports
FOMC meeting begins (announcement expected at 2:00pm EST on Wednesday)
November Case-Shiller HPI to be released at 9:00am EST: +0.4% (estimate)
January consumer confidence to be released at 10:00am EST: 124.3 (estimate)
Happy trading!
Tom


