Market Recap for Tuesday, March 12, 2019
Boeing (BA, -6.15%) was once again a major drag on the Dow Jones as that index ended the session in negative territory (-0.38%), while our other indices were positive. The NASDAQ (+0.44%) was the best performing index as 10 of 11 sectors finished higher. Industrials (XLI, -0.83%) was negatively impacted by Boeing as well. Aerospace ($DJUSAS, -3.50%) and airlines ($DJUSAR, -2.00%) were the two weakest industries and clearly held back industrials.
Healthcare (XLV, +0.73%) jumped to the top of the sector leaderboard as medical supplies ($DJUSMS, +1.21%) attempts to carve out a bottoming reverse head & shoulders pattern:
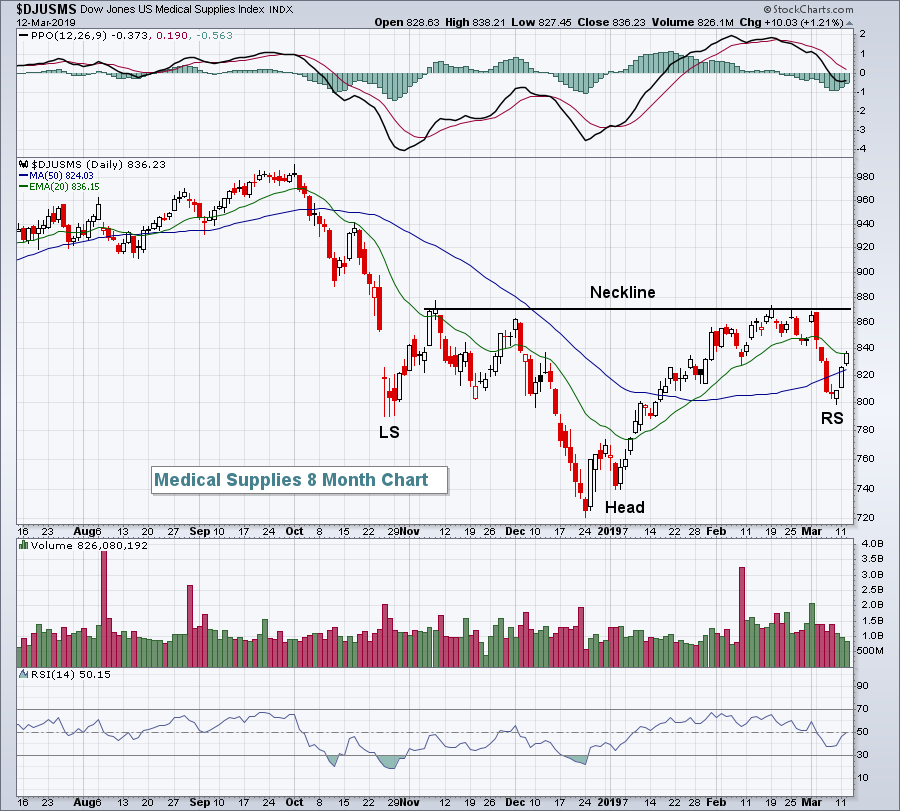 A breakout above 870 would confirm the pattern, while a definitive break beneath the left shoulder near 790 would leave a ton of doubt.
Pre-Market Action
Gold ($GOLD) is trading this morning above $1300 per ounce. Crude oil ($WTIC) is up more than 1% to $57.56 per barrel. We haven't seen crude close above $57.50 since the second week of November. Higher crude prices are typically a signal of improving global economic strength, or at least anticipation of improving strength.
Asian markets were weak overnight, while European markets are closer to their respective flat lines. That hasn't hurt U.S. futures as the Dow Jones looks to open higher (futures up 82 points at last check). Boeing (BA) is attempting a rebound this morning, aiding Dow futures.
Current Outlook
The following RRG chart shows the recent rotation of five industry groups that have shown considerable relative strength in 2019:
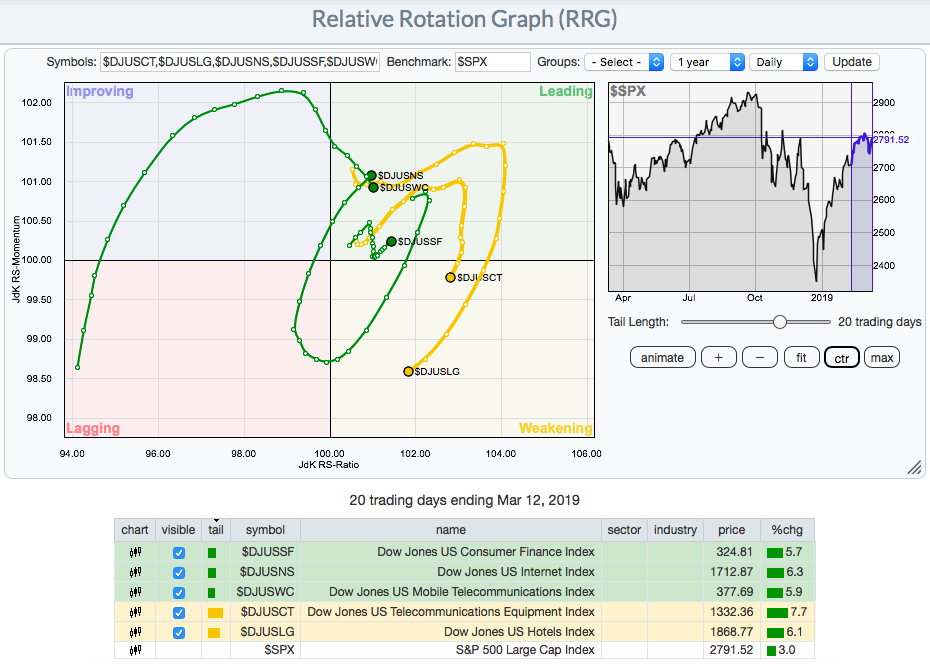 This picture truly does paint a thousand (stock market) words. Each of the industry groups above have gained 5.0%+ over the past 20 trading days, easily surpassing the benchmark S&P 500's performance over that period. The wildest ride, however, is that of the internet group's ($DJUSNS). If you look at the RRG chart, the rotation of internet stocks has taken it through all 4 of the RRG quadrants - leading, weakening, lagging, improving - in just 20 days! How does this happen? Well, let's take a look at the DJUSNS on a SharpChart and study these moves:
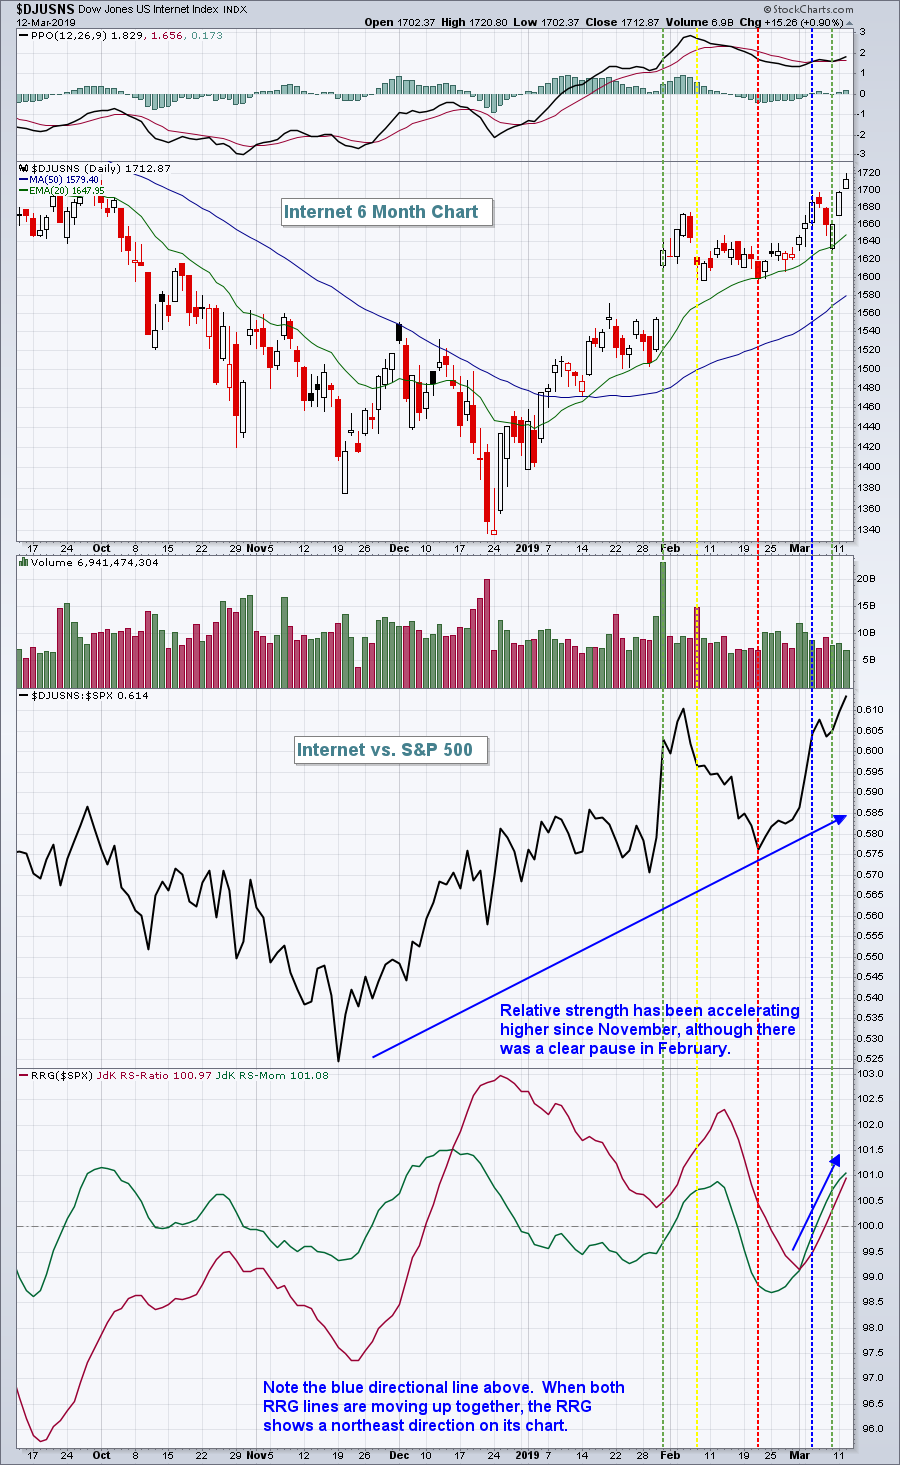 The different colored vertical lines on the chart are intended to roughly coincide with the colors on the RRG chart - leading (green), weakening (yellow), lagging (red), improving (blue). Note that when the DJUSNS moves through lagging and into improving, the price action is simply a pullback to test the rising 20 day EMA. My conclusion is that analyzing RRG charts can provide you with a starting point to identify great trading opportunities. We should not invest based on an RRG chart without first referring to the SharpChart.
Internet currently looks like a great place to consider trading opportunities.
Sector/Industry Watch
The Dow Jones U.S. Broadcasting & Entertainment Index ($DJUSBC, +0.55%) closed above 1360 and at a 52 week high on Tuesday, suggesting higher prices ahead. Just beware the all-time highs in the 1380 area that could provide headwinds, or at least a bit of hesitation:
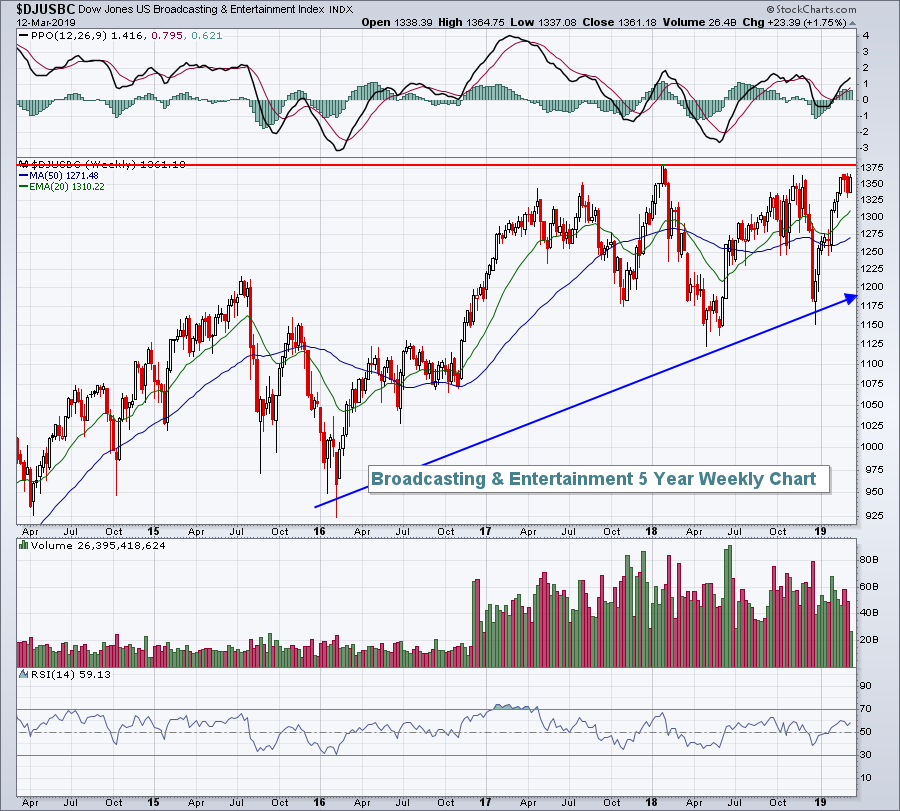 Walt Disney (DIS) could use the group strength to forge a breakout of its own, so DIS would likely be one beneficiary. Other current 2019 stalwarts in the group include Gray Television (GTN), Nexstar Media Group (NXST), and Sinclair Broadcast Group (SBGI). These already-strong stocks would continue to benefit from a breakout and further rotation into its industry group.
Historical Tendencies
Recent strength in Apple, Inc. (AAPL, +1.12%) coincides with its seasonal pattern, which historically has resulted in March and April gains. Here's the seasonality chart for AAPL for the past two decades:
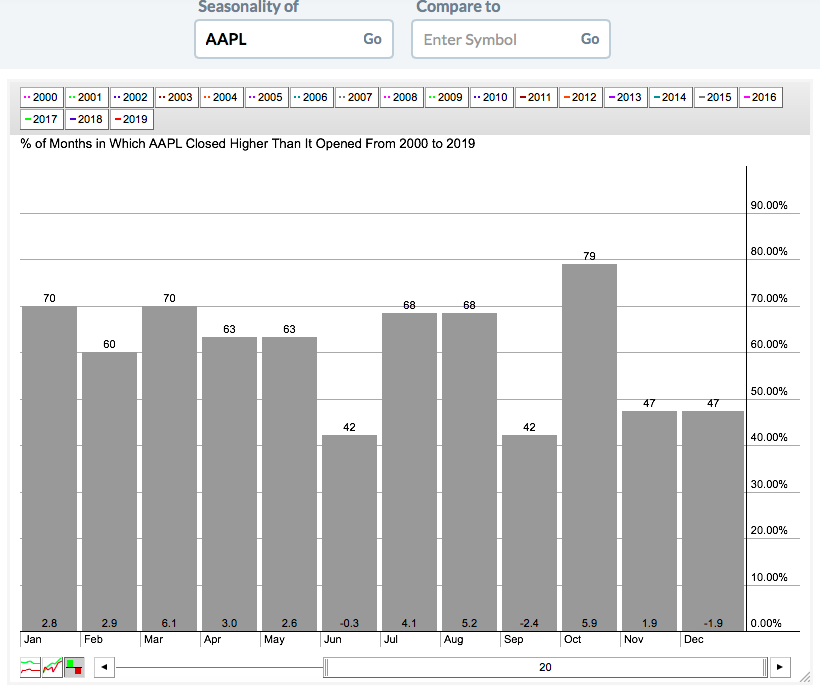 Combined, March and April have produced averaged gains of 9.1% for AAPL since 1999, so its recent price breakout is further confirmed by seasonal strength.
Key Earnings Reports
(reports after close, estimate provided):
CLDR: (.11)
MDB: (.38)
SMTC: .54
Key Economic Reports
January durable goods released at 8:30am EST: +0.4% (actual) vs. -0.6% (estimate)
January durable goods ex-transports released at 8:30am EST: -0.1% (actual) vs. +0.1% (estimate)
February PPI released at 8:30am EST: +0.1% (actual) vs. +0.2% (estimate)
February Core PPI released at 8:30am EST: +0.1% (actual) vs. +0.2% (estimate)
January construction spending to be released at 10:00am EST: +0.3% (estimate)
Happy trading!
Tom


