Market Recap for Monday, March 25, 2019
U.S. stocks finished in bifurcated fashion on Monday as the S&P 500 and NASDAQ lost 0.08% and 0.07%, respectively, while the Dow Jones tacked on 0.06%. The small cap Russell 2000 was a relative outperformer, gaining 0.46% on the session. All of our major indices were struggling and in negative territory with 90 minutes left in the trading day. Resiliency then surfaced, as we often see during bull market advances. One big positive was the reversal in the Volatility Index ($VIX) after testing overhead resistance near 18:
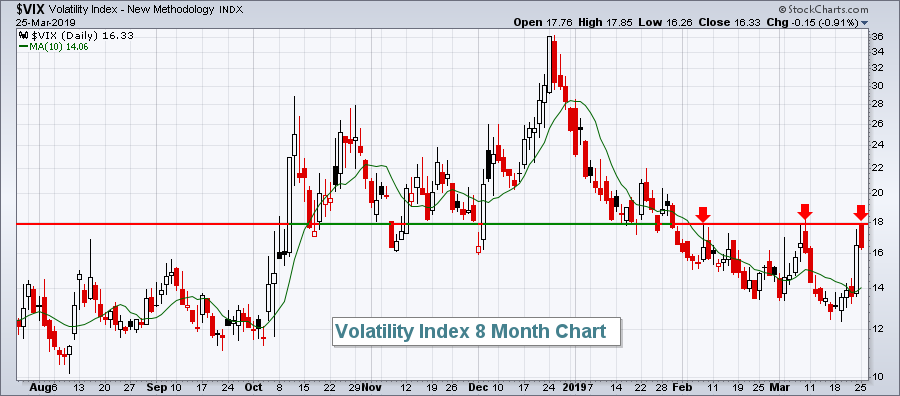 A rising VIX that clears prior highs is problematic for longs. Higher fear levels create a much better environment for shorts as the stock market will often have knee-jerk reactions to bad news as impulsive selling returns. Therefore, let's watch the 18 level closely. A close above that level would definitely begin to favor more short-term selling, while a return below the 10 day SMA of the VIX would indicate the worst is behind us.
Consumer discretionary (XLY, +0.59%) performed very well on Monday, while technology (XLK, -0.44%) and financials (XLF, -0.43%) lagged. A major beneficiary of this lower 10 year treasury yield ($TNX) environment is home construction ($DJUSHB, +2.71%), which was the biggest reason for outperformance by the XLY:
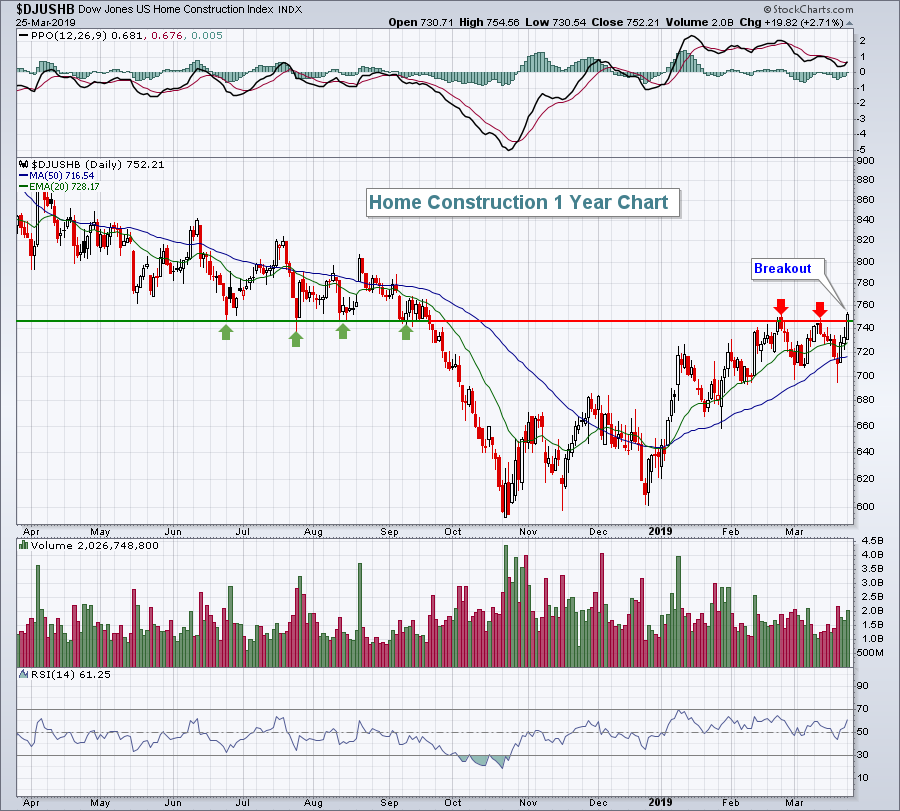 The breakout is significant and I would expect to see continuing leadership from home construction as it now appears that the Fed has backed off of its rate-hiking campaign.
Meanwhile, the lower treasury yields are putting severe pressure on financials, especially banks ($DJUSBK). Semiconductors ($DJUSSC, -1.20%) dropped to test their rising 20 day EMAs and that was the primary reason that technology stocks underperformed.
Pre-Market Action
Crude oil ($WTIC) has jumped 1.70% this morning and is back close to $60 per barrel. Asian stocks were mixed overnight, while we're seeing a rebound in Europe. With roughly 30 minutes left to the opening bell, Dow Jones futures are higher by 114 points.
Current Outlook
I've changed my focus right now to shorter-term intraday charts, searching for clues as to the next major stock market move. The negative divergences on the daily charts are making for a difficult market environment as slowing momentum on a daily chart can take a couple weeks for the PPO to reset back to its centerline. While this is my expectation, the market doesn't always do what we think it will. So I want to be prepared if the 3 month uptrend resumes. Last week's selling saw all of our major indices fall back beneath now-declining 20 hour EMAs. An initial test will be reclaiming those 20 hour EMAs. Here's the current look at the NASDAQ's hourly chart:
 There are a few support levels to keep an eye on. The initial gap support from two weeks ago just below 7600 held on its first test. Should that fail, there's a current uptrend channel in play with a lower uptrending line that's approaching 7500. Finally, there's the early-March low near 7330 and this is the big one. The NASDAQ, like many areas of the market, has a negative divergence on its daily chart, suggesting a possible upcoming 50 day SMA test (not shown above). The NASDAQ's 50 day SMA is currently at 7393. So if price support near 7330 is lost, it means that the 50 day SMA has also been lost. Much more selling could occur if price support there doesn't hold.
To the upside, I'm simply watching that declining 20 hour EMA, currently at 7674. A sustained move through that moving average would indicate the bulls are regaining control of the near-term action. The high last Thursday would then become the target.
Sector/Industry Watch
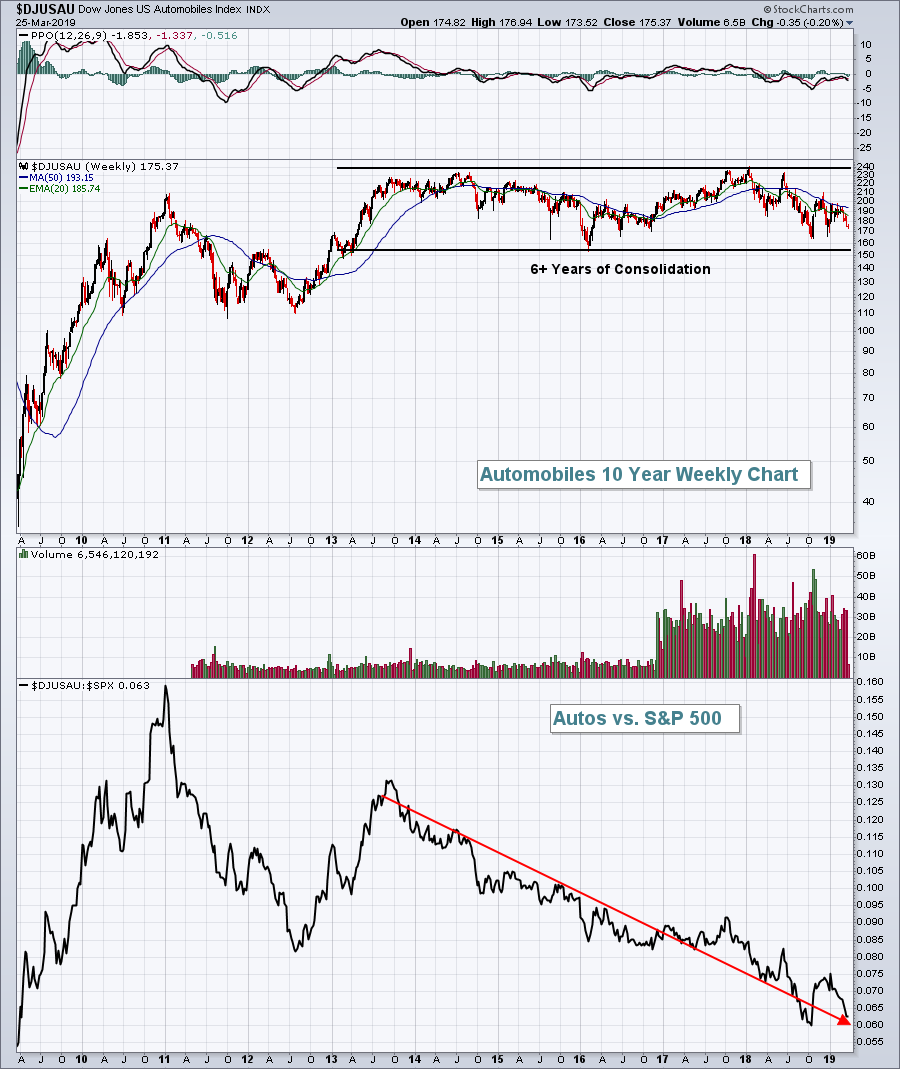
I'm not typically a fan of the automobile industry ($DJUSAU). One look at their absolute and relative performance (vs. the benchmark S&P 500) since the March 2009 low will help to illustrate my point:
 One reason for the dismal performance the past couple years has been Tesla's (TSLA) inability to break out of its own consolidation range as it's drifted back to test long-term price support:
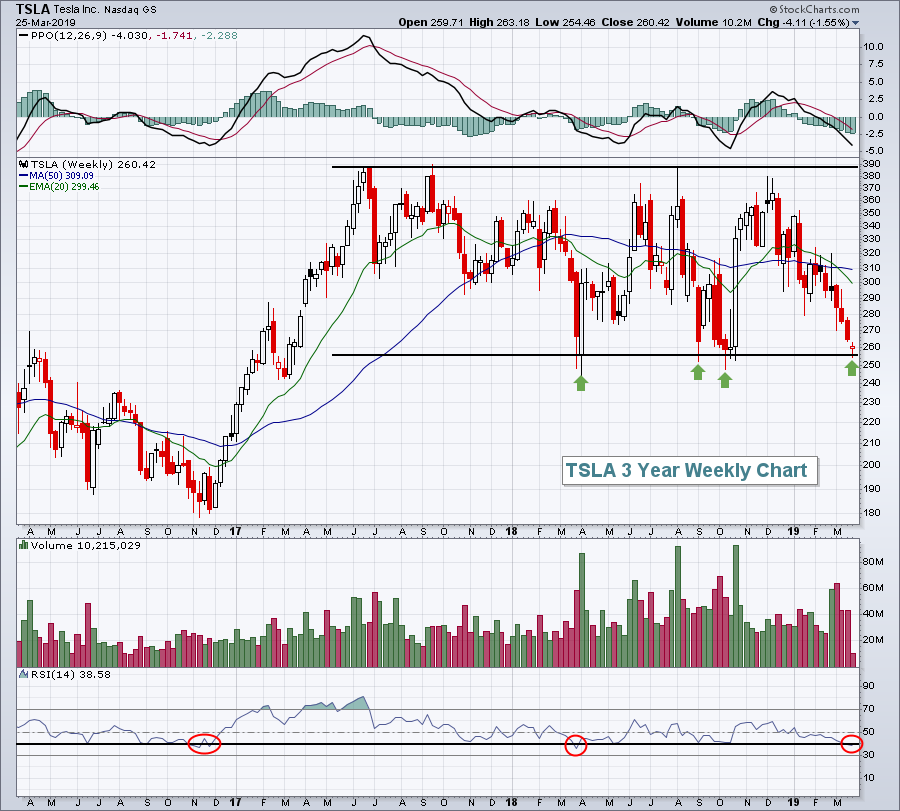 Buyers seem to re-emerge around that 250-260 area. The red circles highlight breaks of weekly RSI support at 40. The past two breaks resulted in major bottoms for TSLA and we're just now piercing the RSI 40 level again.
Historical Tendencies
As we approach April, it's worth noting that the next three months (April through June) have historically been the most bullish for Tesla, Inc. (TSLA):
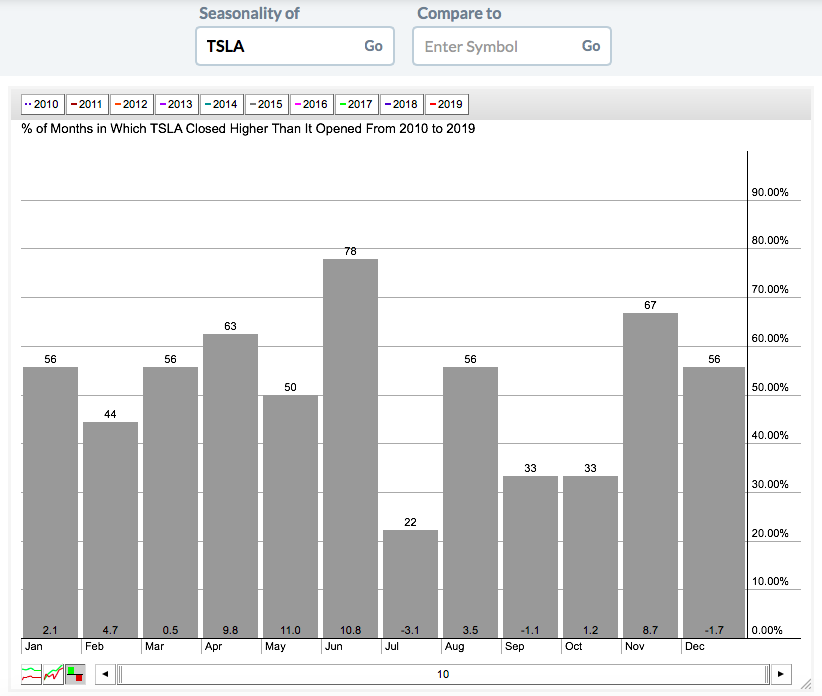 The average gains of 9.8%, 11.0% and 10.8% for the next three months is difficult to ignore. Should the price support shown in the earlier chart hold, TSLA could be poised for another big Spring run.
Key Earnings Reports
(actual vs. estimate):
CCL: .44 - estimate, awaiting results
FDS: 2.42 vs 2.34
INFO: .60 vs .57
MKC: 1.12 vs 1.06
(reports after close, estimate provided):
KBH: .27
OLLI: .70
Key Economic Reports
February housing starts released at 8:30am EST: 1,162,000 (actual) vs. 1,201,000 (estimate)
February building permits released at 8:30am EST: 1,296,000 (actual) vs. 1,300,000 (estimate)
January Case Shiller HPI to be released at 9:00am EST: +0.3% (estimate)
January FHFA home price index to be released at 9:00am EST: +0.4% (estimate)
March consumer confidence to be released at 10:00am EST: 133.0 (estimate)
Happy trading!
Tom


