Market Recap for Friday, March 22, 2019
Investors were worried on Friday and it was reflected in the Volatility Index ($VIX), which rose more than 20%, and sharply lower U.S. equity prices. The small cap Russell 2000 was hit hardest, dropping 3.62%. The weakness, however, was felt just about everywhere. The NASDAQ, S&P 500 and Dow Jones fell 2.50%, 1.90%, and 1.77%, respectively, as negative divergences kicked in. I wrote last week about moving to cash as warning signs were mounting. My blog article last Tuesday, "Negative Divergences Could Wreak Havoc On U.S. Stocks", discussed slowing momentum signals and a possible trip to test the rising 50 day SMA. We're on our way as you can see from this S&P 500 chart:
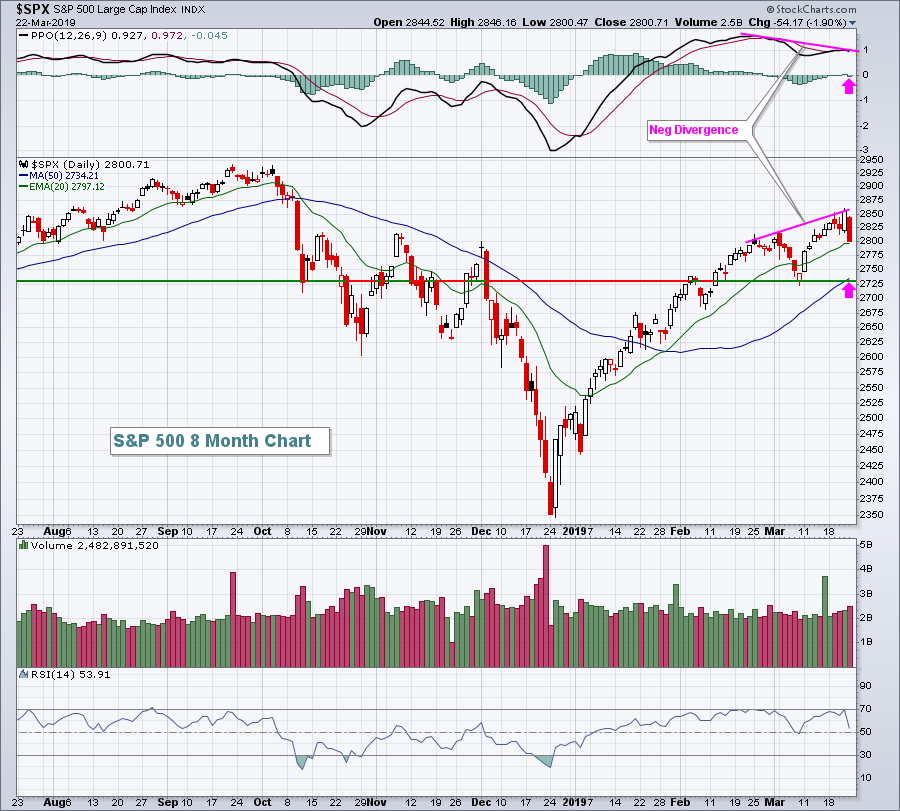 Also, market action the week after monthly options expire is generally not very good. Throw in the tumbling treasury yields, which I also warned about last Thursday in my article, "The Bond Market Is Sending Us The Most Bearish Signal", and it's clear we need to be cautious in the very near-term. Technical analysis never provides us a guarantee that anything will occur, but it does tell us a story. The plot of the current story says to be very, very careful. For me, the most important consideration, bar none, is the combination of price support/resistance and volume. The recent price low on the S&P 500 is close to 2730. The rising 50 day SMA is currently at 2734. During an uptrend, the rising 20 week EMA also provides excellent support and it currently resides at 2728. Clearly, this is an important area to watch on further selling. We know that impulsive selling tends to occur with a VIX above 20 and price support lost. Therefore, I'd grow even more cautious if you see the VIX spiking further and the S&P 500 moving (and closing) beneath the 2725 level.
Economic weakness abroad has become very clear. The European Central Bank (ECB) was slower to act than the Federal Reserve, but it is on a program of quantitative easing (QE) to help spur economic activity in Europe. On Friday, the German PMI manufacturing number fell to 44.7, well below the 50 threshold that suggests economic contraction. One big concern in the U.S. is that economic weakness in Asia and Europe will lead to a recession here and the inversion of the yield curve last week increased the odds of that. However, the rate of change (ROC) in U.S. jobs is generally a very good economic indication and, despite the February job slowdown, the ROC remains quite strong. I'd be very patient at this time before making any longer-term prediction about the direction of U.S. equity prices. I believe we remain in a secular bull market with higher prices ahead. Could we see weakness and/or consolidation in the foreseeable future? Absolutely. In fact, the bond market is arguing for exactly that.
10 of 11 sectors fell on Friday, with only the defensive utilities group (XLU, +0.72%) gaining ground. The combination of a strengthening U.S. Dollar Index ($USD, +0.17%) and growing worldwide economic fears resulted in underperformance by materials (XLB, -2.98%) and energy (XLE, -2.70%). These two sectors, especially materials, will likely remain under tremendous pressure on a relative basis. The strong dollar almost guarantees it. Financials (XLF, -2.76%) also performed very poorly as the inversion of the yield curve creates tremendous headwinds for areas like banks ($DJUSBK, -3.74%) and life insurance companies ($DJUSIL, -3.32%).
Pre-Market Action
Asian markets tumbled overnight, following the U.S. selling that we saw on Friday. The Nikkei Average ($NIKK, -3.01%) and Hang Seng Index ($HSI, -2.03%) led the way, while China's Shanghai Composite ($SSEC, -1.97%) also sold off. European markets are fairly stable this morning after considerable selling pressure on Friday. It will be extremely important to watch the German DAX ($DAX). Why? Well, the DAX and S&P 500 are as positively correlated as any two global markets. The DAX suffered a head & shoulders breakdown on its weekly chart in early Q4 2018 and last week tested its neckline resistance for the first time and failed. Here's a current look at that chart:
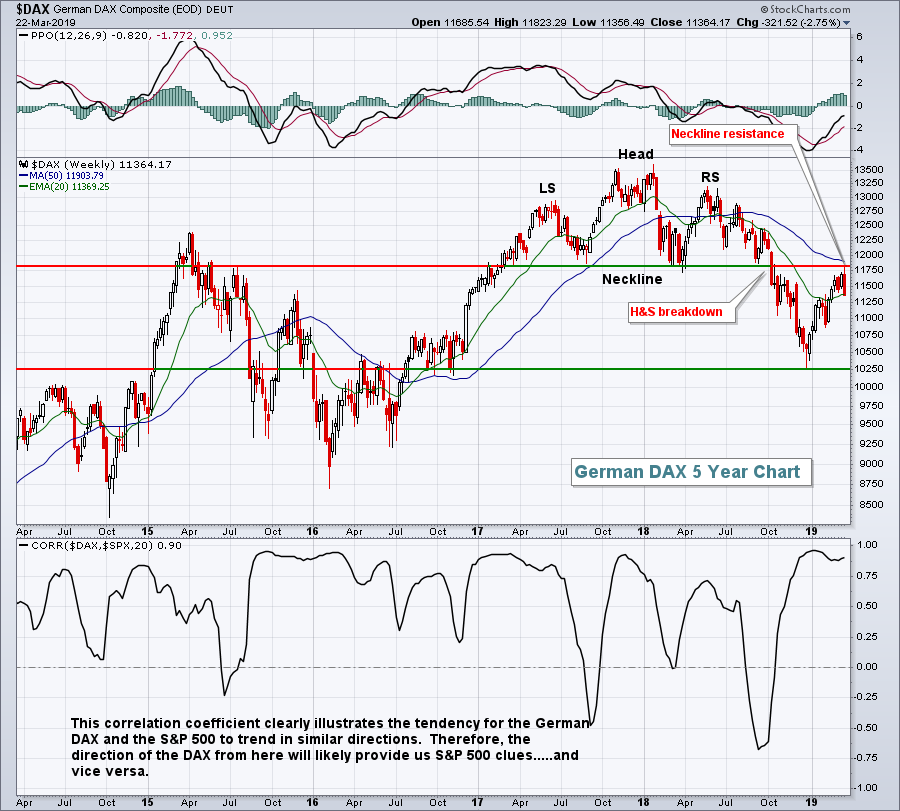 That H&S pattern measured to approximately 10100. We nearly reached that level on the late-December low. The DAX is now rangebound between 10250-11800. I suspect that as the DAX searches for direction, the S&P 500 will likely do the same. Therefore, don't expect a quick resumption of the recent S&P 500 rally. Instead, we'll likely see several false breakouts and false breakdowns to make trading very challenging, to say the least.
Dow Jones futures are pointing to a lower open, down 25 points as we approach the opening bell.
Current Outlook
Fear was building last week despite higher equity prices. The S&P 500 rose more than 1% from its Friday, March 15th close to its Thursday, March 21st close. Normally we see a falling Volatility Index ($VIX) when the S&P 500 is rising, but during this stretch the VIX actually gained 6%. While it's not completely unusual, as that does happen from time to time, the following chart illustrates that the VIX rising with a simultaneous rise in the S&P 500 needs to be monitored closely as that can foreshadow short-term weakness ahead:
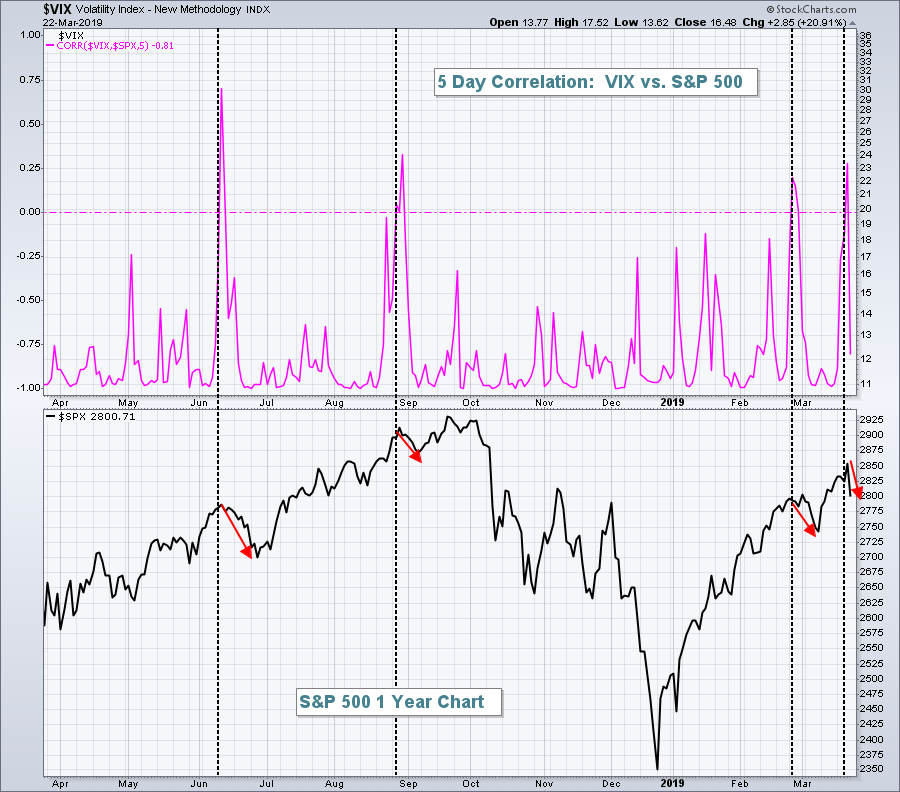 The top part of this chart is the 5 day correlation coefficient between the VIX and S&P 500. Note that it typically remains very close to -1, which is indicative of "inverse" correlation. As stated above, the VIX and S&P 500 normally move opposite one another, but there are exceptions. Four "exceptions" over the past year are highlighted above with vertical black-dotted lines. Note that as the 5 day correlation turns positive - fear building with a rising stock market - the S&P 500 literally hits a brick wall in the short-term. The last three times this occurred, the S&P 500 fell 2-3% over a 1-2 week period. Based on this latest positive correlation reading, we could see additional selling on Wall Street early this week.
While a positive correlation here doesn't provide us any type of guarantee that we'll see falling equity prices, I believe adding this chart to your arsenal of short-term market evaluation tools and strategies would make sense.
If you enjoy thought-provoking charts and articles, please subscribe to my blog. Simply scroll down to the bottom of this article, enter your email address in the box provided and click on the green "Subscribe" button. You'll begin receiving my blog articles the moment they're published. And it's completely FREE! As always, thanks for your support! :-)
Sector/Industry Watch
Financials (XLF, -4.84%) really struggled last week as banks ($DJUSBK, -7.57%) and life insurance ($DJUSIL, -5.56%) were crushed with tumbling treasury yields. But not all areas of financials have been weak as insurance brokers ($DJUSIB, -1.25%) dropped just a bit over 1% last week:
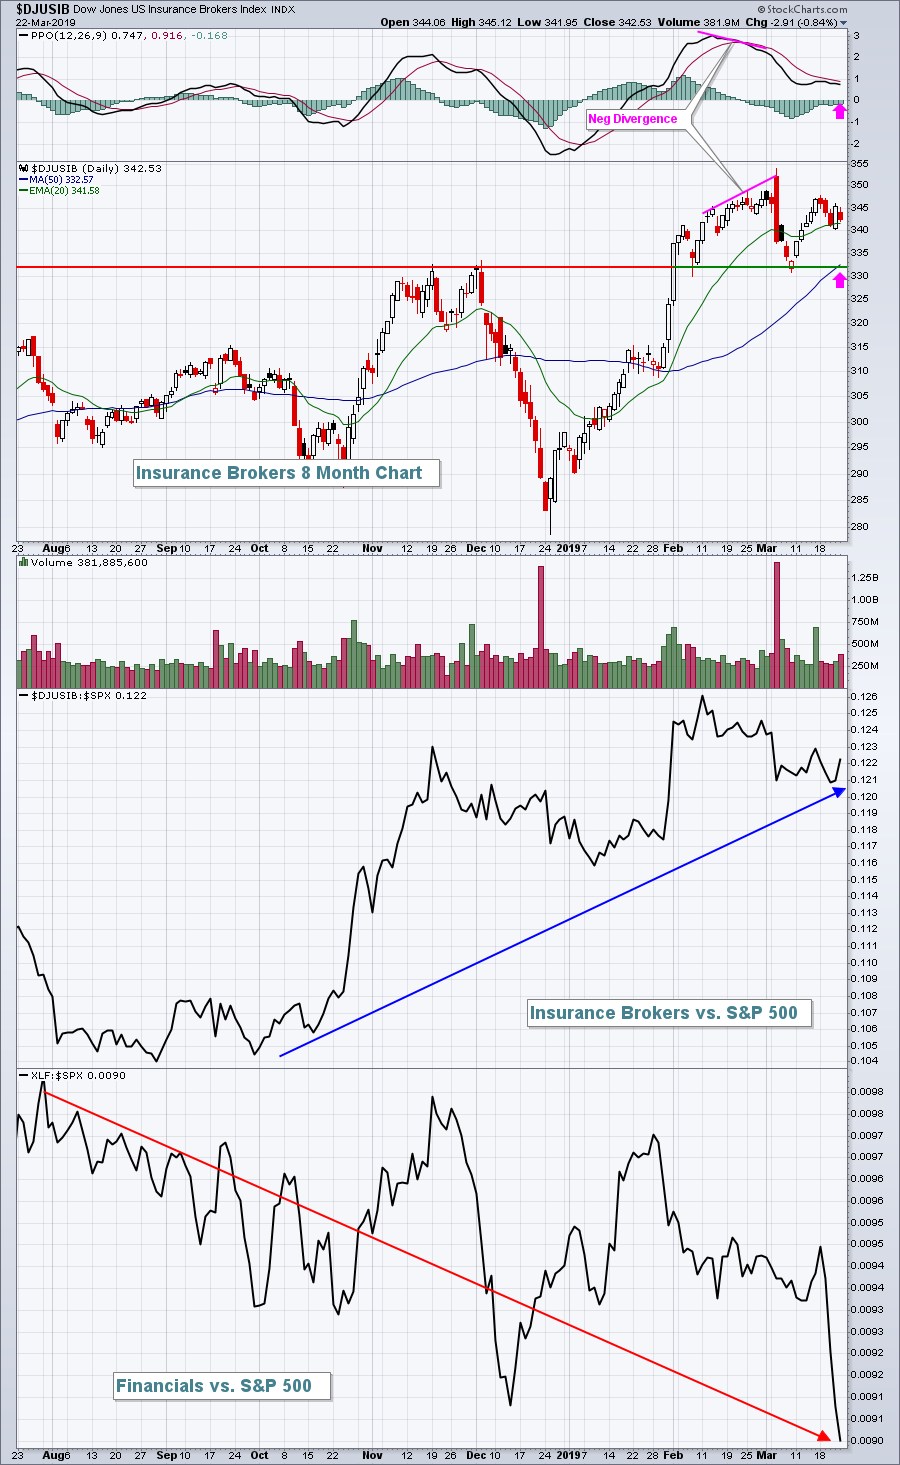 Insurance brokers have been able to easily outperform the S&P 500 despite being part of a sector that has wildly underperformed that benchmark index. But the DJUSIB was not totally immune to selling on Friday as a negative divergence plagues this industry group much like it does the overall stock market. The pink arrows mark potential PPO centerline and 50 day SMA tests. I would want to see the DJUSIB hold onto price support near that 330 level, however, as selling could escalate if it doesn't. Remember, it's part of a weak sector so if price support is lost, I'd look elsewhere for trading opportunities on the long side.
Monday Setups
Deckers Outdoor (DECK, -3.90%) fell nearly 4% on Friday and is rapidly approaching a couple of key technical support levels:
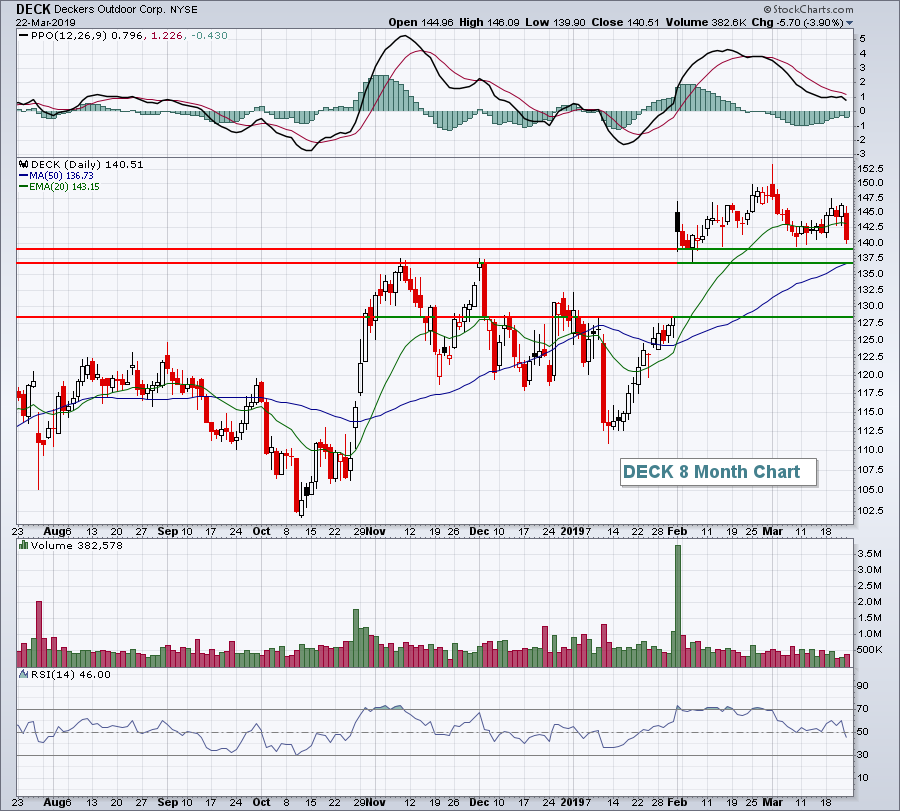 137.00-139.00 represents solid price support and the 50 day SMA currently resides at 136.73. The recent price high just above 153.00 marks the top of a potential trading range. I would be careful, however, if 136.00 does not hold as support, especially if we're seeing fear ramp up and our major indices selling off hard. The next level of support would not be found until the bottom of gap support closer to 128 is tested.
Historical Tendencies
The 26th to 6th of all calendar months have produced stellar results over the years on our major indices. Here's a recap:
S&P 500 (since 1950): +20.73%
NASDAQ (since 1971): +25.93%
Russell 2000 (since 1987): +26.78%
Key Earnings Reports
(reports after close, estimate provided):
RHT: 1.01
Key Economic Reports
None
Happy trading!
Tom


