Market Recap for Monday, March 4, 2019
It's really hard for me to say who won yesterday's market battle. Obviously, we finished lower so I guess that would be the determining factor to say the bears won this battle. But it sure felt like at least a minor victory for the bulls in that heavy early losses were trimmed considerably by the close. And the more aggressive NASDAQ nearly turned green by the close despite an intraday loss that approached 100 points, or approximately 1.25%. It's noteworthy that the selling began on our major indices beneath key price resistance levels, so this certainly could be the start of a bigger picture selloff. We'll need more technical evidence, however, given the buying that took place in the afternoon.
The small cap Russell 2000 was a laggard, dropping 0.89%. The Dow Jones and S&P 500 fell 0.79% and 0.39%, respectively, while the NASDAQ was able to cut its loss to a mere 0.23% by the close. 5 of the 11 sectors actually finished higher, led mostly by defensive groups. Materials (XLB, +0.45%) was the top performer, followed by real estate (XLRE, +0.40%), utilities (XLU, +0.18%) and energy (XLE, +0.18%).
Health care providers ($DJUSHP, -3.81%) tumbled on Monday as healthcare stocks (XLV, -1.36%) were easily the primary culprit for the day's selling. There were worries circulating that regulatory efforts to lower health care costs would undermine many stocks in this group. Unitedhealth Group (UNH, -4.26%) pressured the Dow Jones throughout the session and was a leader, in a negative way, for the entire healthcare group, but especially the providers:
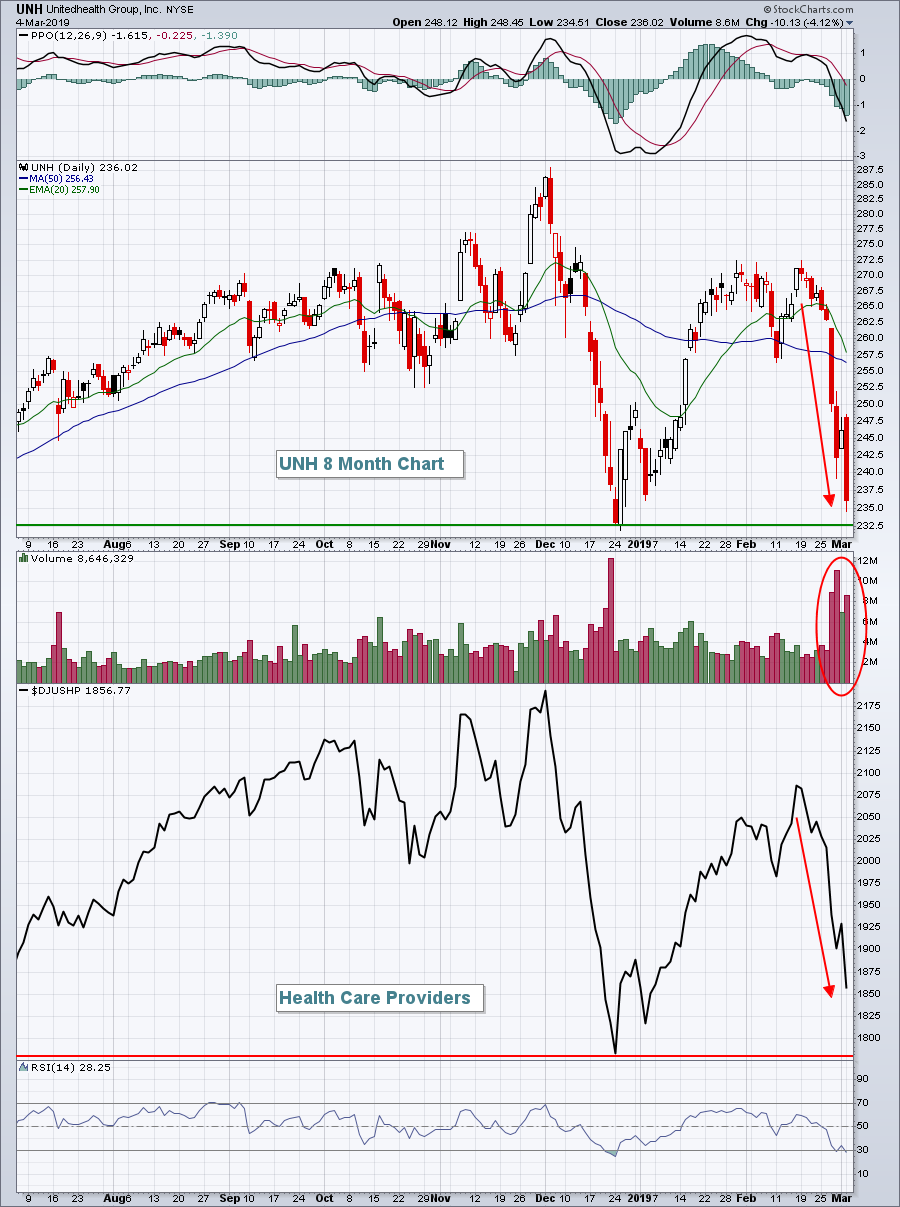 UNH and the entire health care providers industry have been feeling the possible effects of regulatory action for the past couple weeks. The big question now is.....can UNH and the DJUSHP hold price support established in December 2018?
Pre-Market Action
We saw mostly mixed action overnight in Asian markets and we're seeing the same in Europe this morning. Clearly, U.S. equities hit overhead resistance on Monday, causing traders to at least pause after a major run up in prices since the late-December low.
Dow Jones futures are fractionally higher this morning, pointing to a slightly higher open in 30 minutes.
Current Outlook
The U.S. stock market is at a major crossroad right now. Yesterday, the benchmark S&P 500 hit 2816.88, just .06 from the October 17th reaction high at 2816.94. If the sellers were going to show up, the time was at hand.
They showed up:
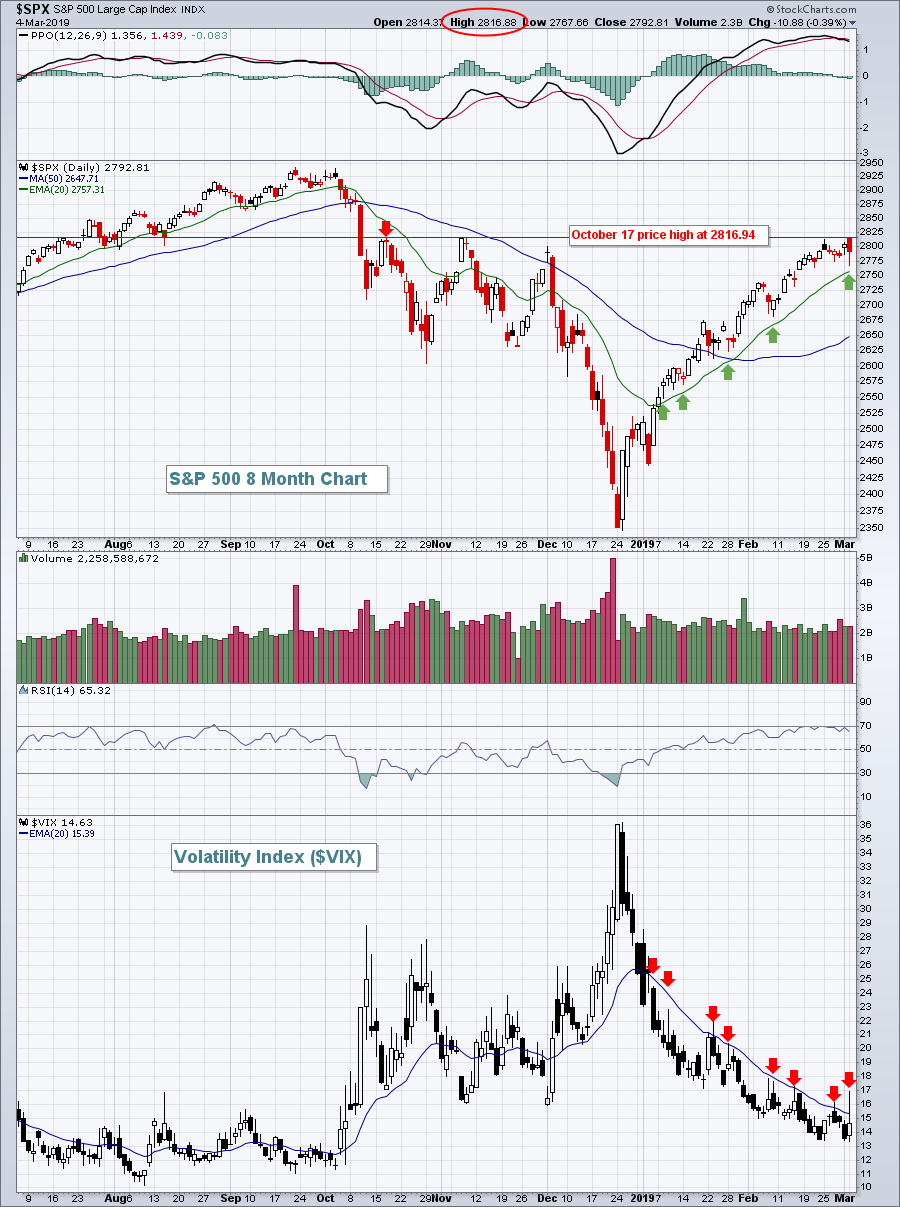 Equities sold off hard on Monday morning, with the Dow Jones down 415 points at its intraday low. But, unlike the December selloff, buyers stepped back in, cutting the Dow's loss in half by the close. The S&P 500 began bouncing before it even tested its rising 20 day EMA. The Volatility Index ($VIX), which attempted to close above its 20 day EMA for the first time in 2019, failed miserably into the close. The 8 red arrows on the chart above show failed breakout attempts on the VIX in 2019. In order for the bears to truly regain short-term control of market action, we need to see the S&P 500 close back beneath its rising 20 day EMA. It's that simple. Technical damage has little chance of sticking until that occurs.
Sector/Industry Watch
Real estate services ($DJUSES) has been a major beneficiary during the market's resurgence off the December lows. The group began showing subtle bullishness in the form of relative strength while printing its final low in late-December. As the DJUSES printed that final low, check out the $DJUSES:$SPX relative strength line:
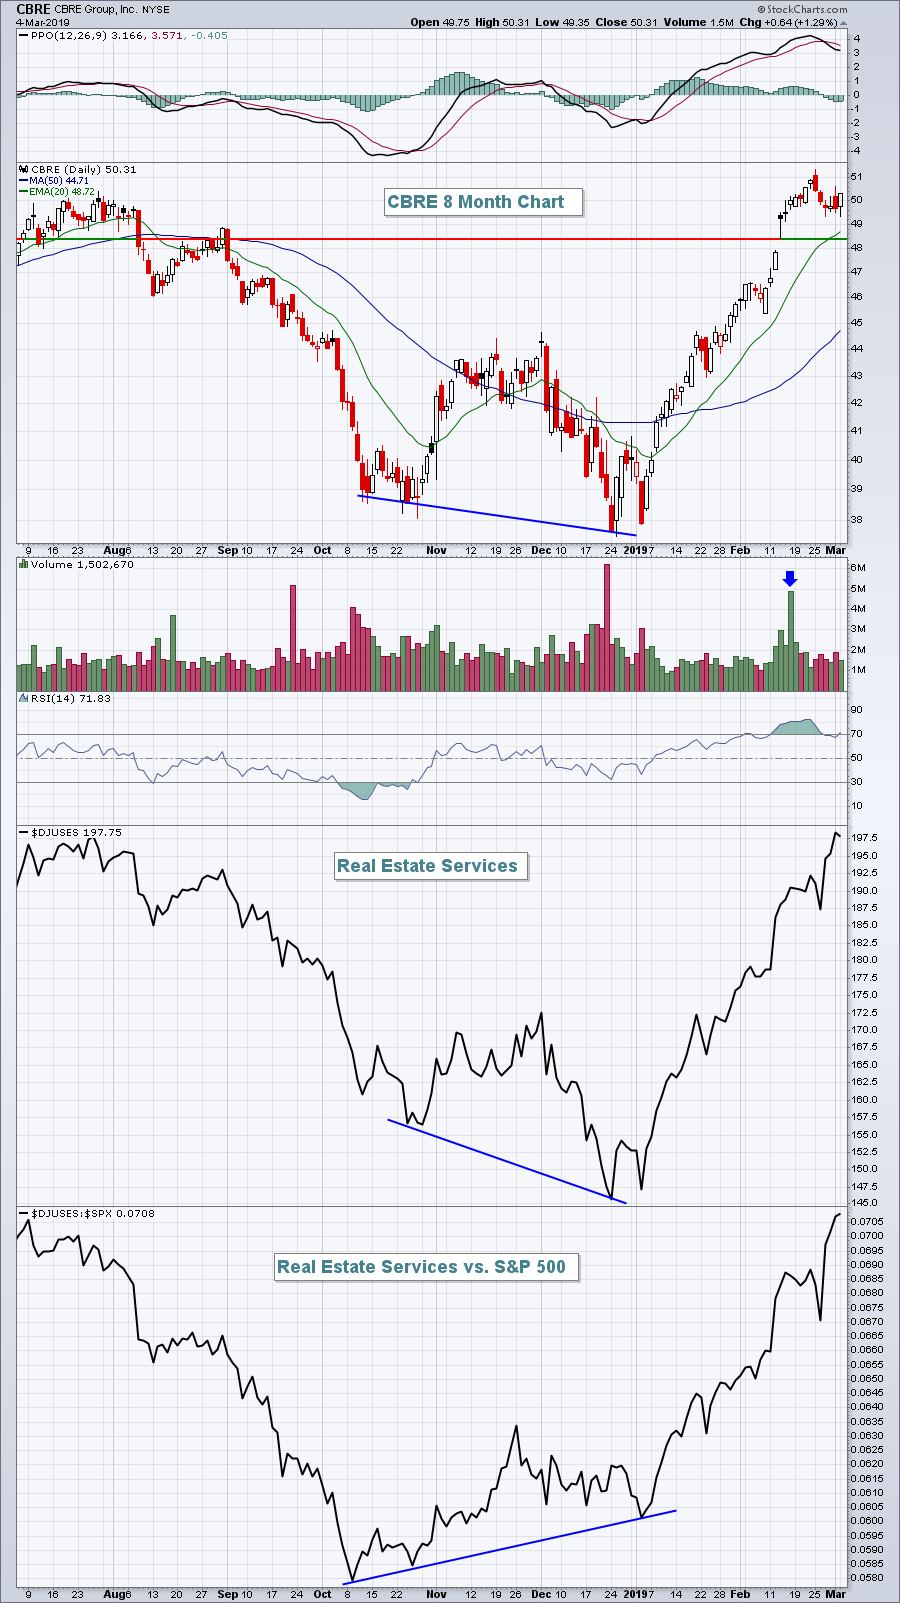 CBRE Group, Inc. (CBRE) is a component stock and one that's been performing exceptionally well during the real estate services advance. This is definitely an outperforming group to consider in the weeks ahead.
Historical Tendencies
Over the past 16 years, CBRE Group, Inc. (CBRE) has earned nearly 70% of its gains during the months of March and April. We're definitely in the seasonal sweetspot for CBRE:
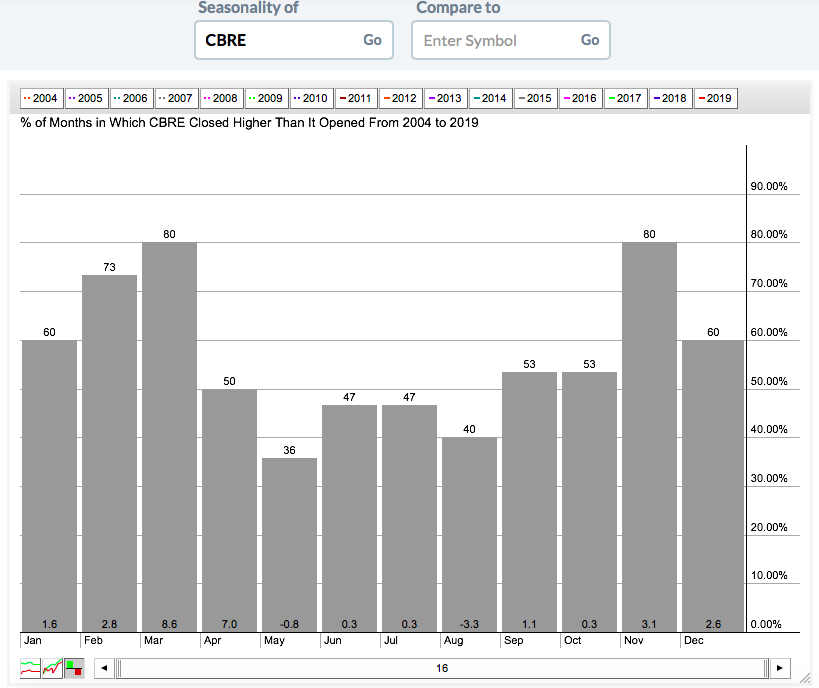 We typically see strength during the first four months of the year and from the chart above in Sector/Industry Watch, CBRE is most definitely following its seasonal tradition. I'm looking for further gains ahead for this financial company.
Key Earnings Reports
(actual vs. estimate):
CIEN: .33 vs .30
KSS: 2.24 vs 2.17
TGT: 1.53 vs 1.52
(reports after close, estimate provided):
COO: 2.50
ROST 1.13
URBN: .79
Key Economic Reports
February PMI services index to be released at 9:45am EST: 56.2 (estimate)
December new home sales to be released at 10:00am EST: 590,000 (estimate)
February non-ISM manufacturing index to be released at 10:00am EST: 57.2 (estimate)
Happy trading!
Tom


