Market Recap for Tuesday, March 5, 2019
Another weak start and the inability to finish well contributed to minor losses across our major indices on Tuesday. Relative weakness in the small cap Russell 2000 resulted in a 0.45% loss there, while our other major indices fell more modestly - Dow Jones (-0.05%), S&P 500 (-0.11%) and NASDAQ (-0.02%). 8 of the 11 sectors finished in negative territory, led primarily by industrials (XLI, -0.64%), which had been the best performing sector of 2019, gaining just over 17% since the start of the year. Diversified industrials ($DJUSID, -1.60%) and trucking ($DJUSTK, -1.59%) were laggards that contributed to the relative weakness in industrials.
There were definitely pockets of strength, however, as communication services (XLC, +0.63%) continued their resurgence. They're also the best performing sector over the past week. Internet stocks ($DJUSNS, +1.53%) were once again strong and this a group that's showing very bullish signs of late. It never hurts to get a breakout from the likes of Alphabet (GOOGL, +1.37%):
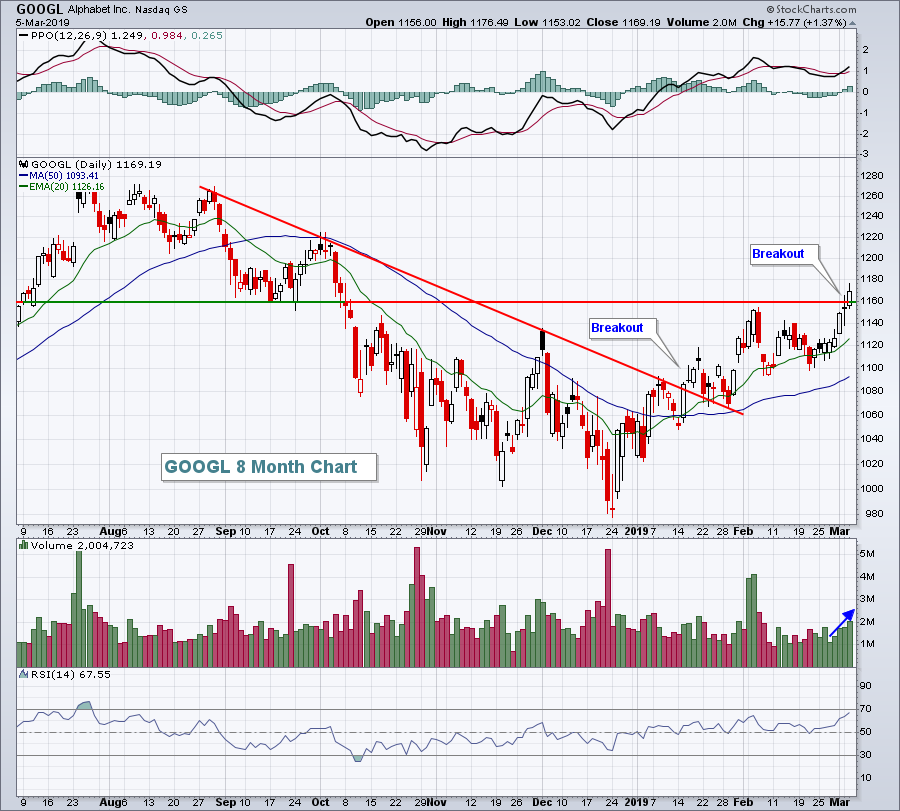 Volume has been increasing this week as GOOGL rallies, a sign of accumulation. Clearing overhead price resistance helped technically for sure. Given the current technical outlook, I suspect we'll see GOOGL lead the internet industry higher.
Retailers got a boost on Tuesday as Target Corp (TGT, +4.58%) and Kohls Corp (KSS, +7.31%) both surged after reporting quarterly results that topped consensus estimates. The diversified retail ETF (XRT) climbed 0.82% and appears poised for further gains, especially considering its seasonal tendencies.
Pre-Market Action
A key economic report, the February ADP employment report, was released this morning and it showed 183,000 new jobs, slightly beating the 180,000 consensus estimate. More significantly, however, was the January number, which was revised higher from 213,000 to 300,000. The more closely watched nonfarm payrolls report will be released on Friday morning at 8:30am EST.
Crude oil prices ($WTIC) are lower by approximately 1.25% so that could weigh on the energy group.
Overnight, shares in China soared another 1.57% as the Shanghai Composite ($SSEC) has now gained approximately 25% off its early January low. The $SSEC:$SPX ratio has been gaining steadily in 2019 after 3 years of awful relative performance:
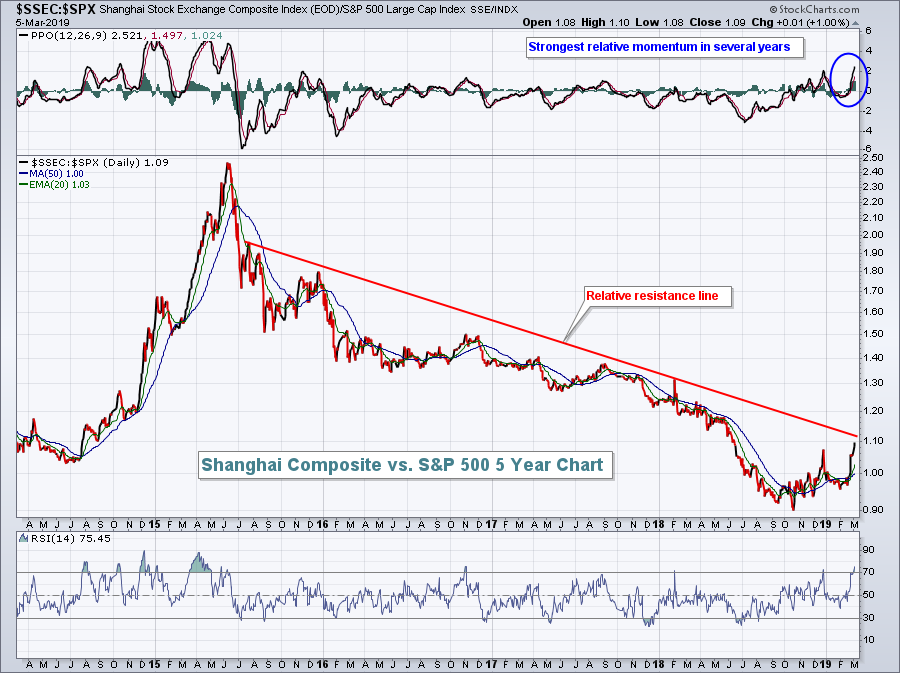 This could just be a short-term countertrend relative bounce, but breaking that relative downtrend line would likely suggest more than that.
Dow Jones futures are pointing to a negative start to the day as they're down 30 points with 30 minutes remaining to the opening bell.
Current Outlook
I like to evaluate the strength of market rallies by examining where the money goes. In a sustainable market rally, I want to see investors/traders in a "risk on" mood. Aggressive sectors include technology (XLK), consumer discretionary (XLY), communication services (XLC), industrials (XLI) and financials (XLF). Here at StockCharts.com, there are various ways to analyze sector performance, but one of the best ways is to simply plot these sectors on an RRG chart vs. the benchmark S&P 500 and visualize how money is rotating. Currently, it appears to be rotating rather bullishly:
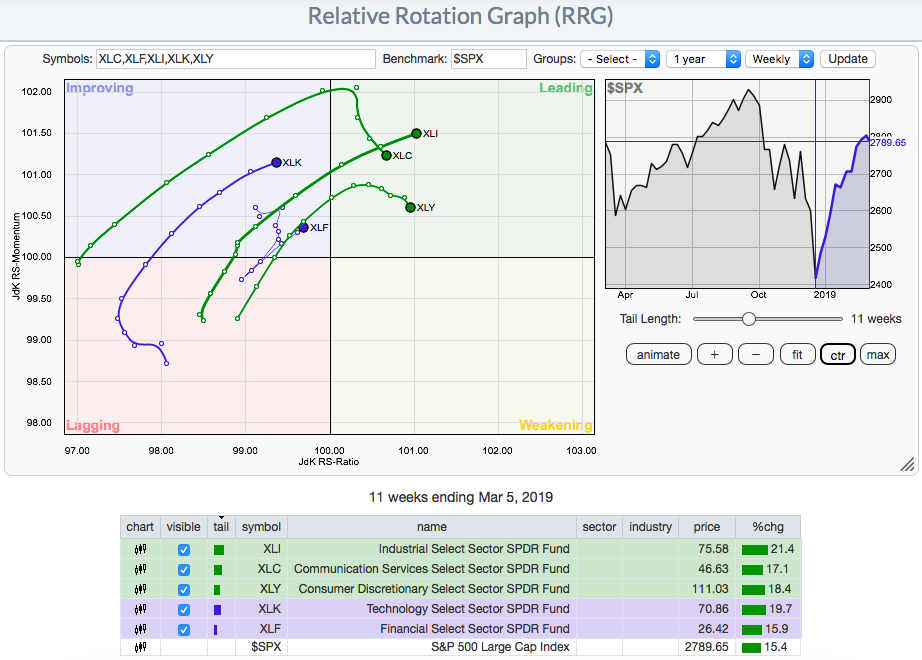 I deliberately set the "tail length" to 11 weeks so that we could track the relative performance of these 5 aggressive sectors throughout the market's rally off the December bottom. Strength on RRG charts can be seen by a stock, ETF, sector, index, etc., moving in a northeast fashion vs. the benchmark. In this case, all 5 sectors seem to be aiding the current market rally and that's exactly what we want to see. Note at the bottom table in the chart above that every one of these 5 aggressive sectors have outperformed the S&P 500 since that bottom - excellent performance indeed.
If you enjoy my daily analysis of the market, please subscribe below. It's easy and it's FREE! Simply scroll down to the bottom of this article, type in your email address in the space provided and click on the green "Subscribe" button. I appreciate your support. If you ever want to send me a comment directly, please do so via "tomb@stockcharts.com". Thanks!
Sector/Industry Watch
Retail (XRT) had been under pressure, like the overall market, in Q4 2018. It has since, however, recovered and been trading in much more bullish fashion, holding rising 20 day EMA support on every test in 2019:
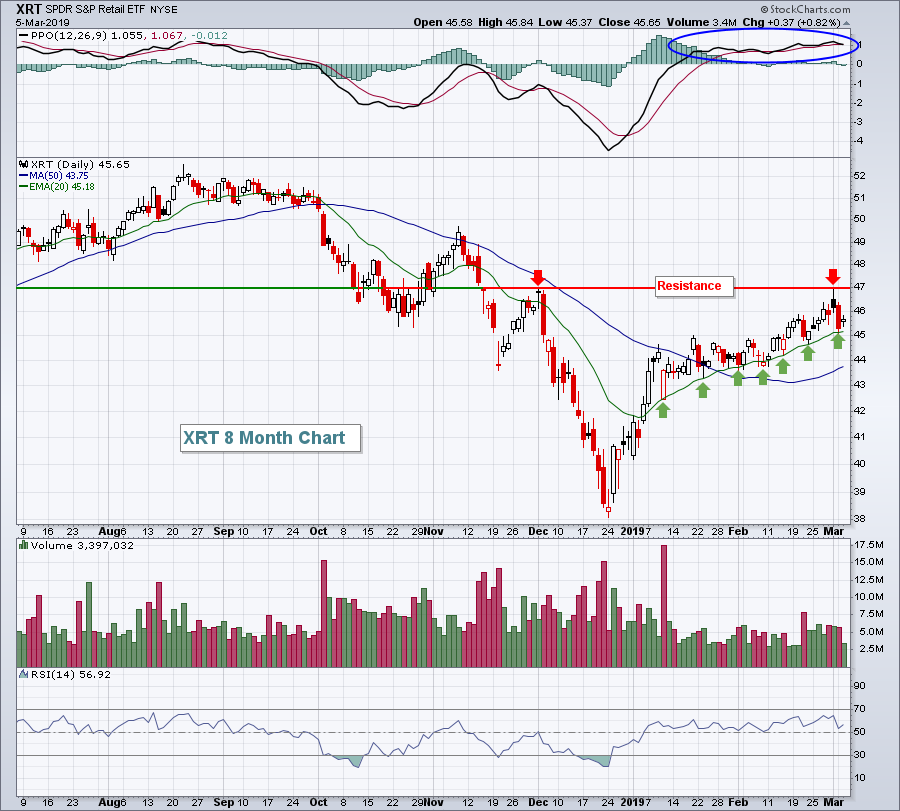 The green arrows highlight the successful 20 day EMA tests, while the two red arrows illustrate the difficulty of clearing overhead price resistance at 47. The trading range that we should watch, therefore, is from the 20 day EMA to price resistance, or 45.18-47.00. Currently, February has been kind to the XRT, as it typically is. March also tends to be an excellent calendar month for the XRT. Check out the Historical Tendencies section below for more details.
Historical Tendencies
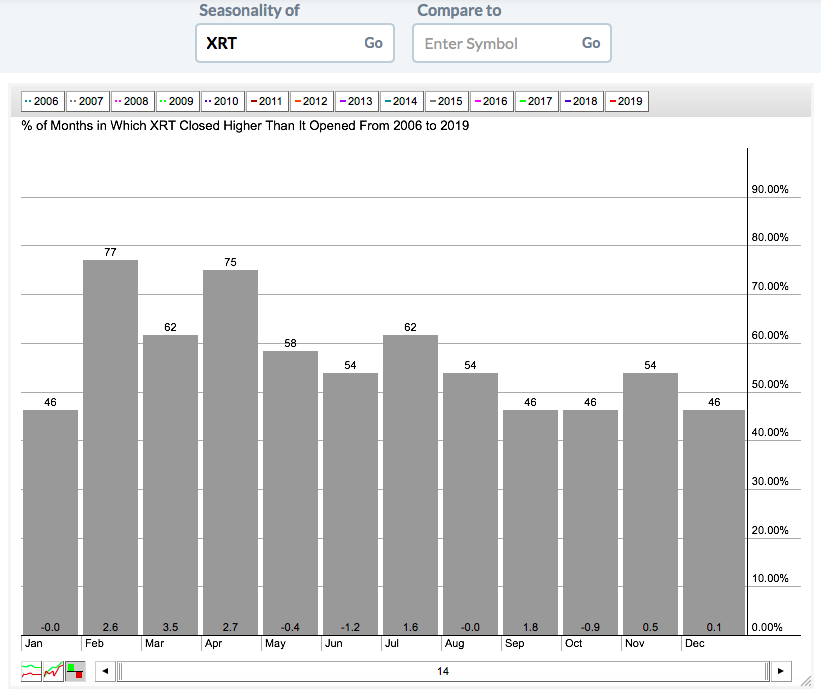
We are in the midst of seasonal strength for retail stocks. The widely diversified retail ETF (XRT) has averaged gaining 8.8% during the February through April period over the last 14 years:
 When we compare the performance of the XRT to the benchmark S&P 500, check out how March stands out:
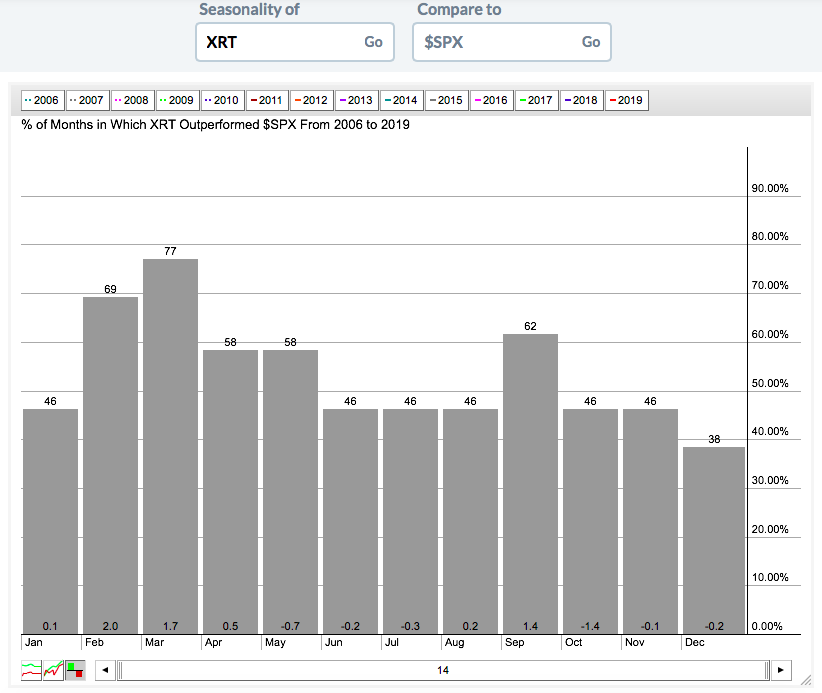 The XRT has outperformed the S&P 500 wildly during March. February also has been a strong relative month for retailers. Between February and March, the XRT has outperformed the S&P 500 by an average of 3.7% over the past 14 years.
Key Earnings Reports
(actual vs. estimate):
BF.B: .47 vs .44
DCI: .47 vs .51
DLTR: 1.93 vs 1.92
(reports after close, estimate provided):
GWRE: .19
Key Economic Reports
February ADP employment report released at 8:15am EST: 183,000 (actual) vs. 180,000 (estimate)
Beige book to be released at 2:00pm EST
Happy trading!
Tom


