Market Recap for Wednesday, March 6, 2019
All of our major indices took a hit yesterday, including the small cap Russell 2000 ($RUT), which once again lagged badly and dropped another 2.01%. The RUT was easily the worst performer as the Dow Jones, S&P 500 and NASDAQ lost 0.52%, 0.54% and 0.93%, respectively. More importantly, the RUT fell below its 20 day EMA for the first time since regaining that key moving average in early 2019:
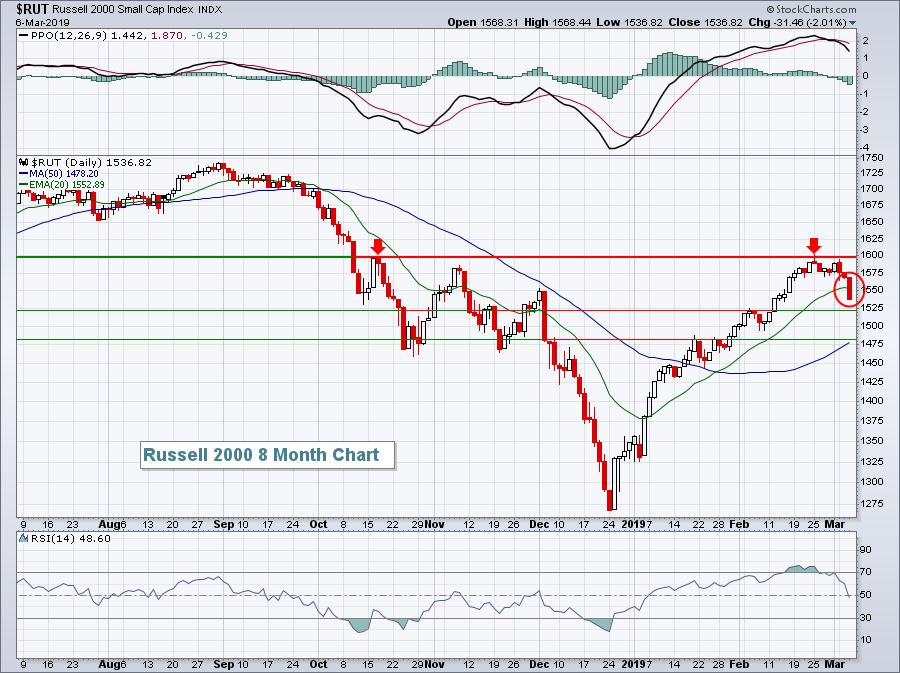 Like the S&P 500, the Russell 2000 moved up last week to test its October reaction high. That's where the bullish trend failed and the Russell 2000 began to roll over. Yesterday's drop, however, was the first technically-damaging candle as the green 20 day EMA was lost. 1520 and 1480 are support levels where we might see the RUT reverse. That latter level coincides with the now-rising 50 day SMA.
Materials (XLB, +0.22%) was the only sector to finish in positive territory, with utilities (XLU, +0.00%) flat. Leading to the downside was healthcare (XLV, -1.46%) and energy (XLE, -1.27%). Medical supplies ($DJUSMS, -2.71%) and biotechnology ($DJUSBT, -2.34%) were primarily responsible for healthcare's weakness. The DJUSMS dropped significantly for the third consecutive session and lost its 50 day SMA, but could this be a reverse right shoulder?
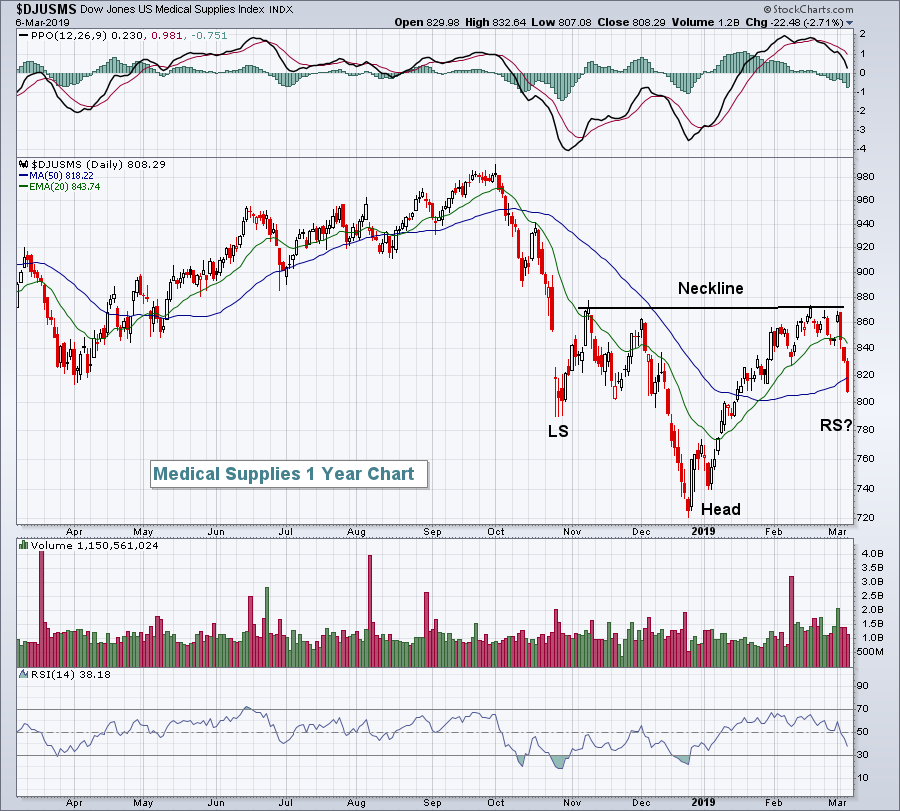 To maintain the symmetrical nature of this pattern, it would be best if the DJUSMS doesn't close below 800. Therefore, it'll need to turn quickly.
The selling came on a day when solid jobs data was released. While the February ADP employment report showed only a slight beat (183,000 vs. 180,000), January was revised significantly higher, from 213,000 to 300,000. All eyes will now be on the February nonfarm payrolls report, which will be released tomorrow morning before the bell.
Pre-Market Action
Asian markets were mostly lower overnight, although China's Shanghai Composite ($SSEC) continued its ascent. European markets were lower this morning, but the European Central Bank announced further stimulus (ie, cheap loans to European banks) to help its floundering economy and that helped to perk up stocks in that region. That also aided U.S. futures, which previously were pointing to a lower open. Dow Jones futures, with 30 minutes to the opening bell, turned positive on the news, up 24 points at last check.
Initial jobless claims came in slightly higher than forecast this morning as traders await the important monthly nonfarm payrolls report, which will be released at 8:30am EST Friday morning.
Current Outlook
The Volatility Index ($VIX, +6.78%) spiked on Wednesday and this index highlights the level of fear in the stock market. Rising fear = lower prices nearly every time. The VIX rose for the third consecutive session yesterday. While that might not seem like much, it's the first time it's happened in 2019. The VIX also closed above its 20 day EMA for the first time in 2019. I'm not going to predict a stock market rout because of these developments, but it's clearly the bears' first real technical damage inflicted this year. In order to stem the tide, the bulls will now need to reverse this rising trend in fear:
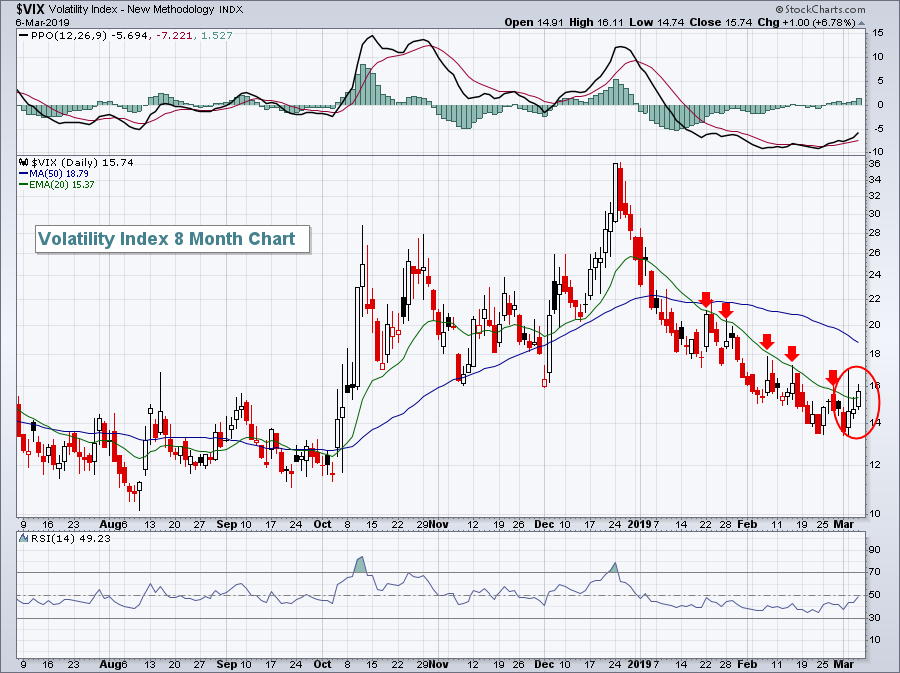 Long tails to the top off of an uptrend can be a very important signal that the rising level of fear is reversing. This occurs because in a stock market reversal, buying normally resumes in the afternoon after morning selling.
Sector/Industry Watch
Energy (XLE) fell yesterday to test its 20 day EMA, which is exactly what crude oil prices ($WTIC) did:
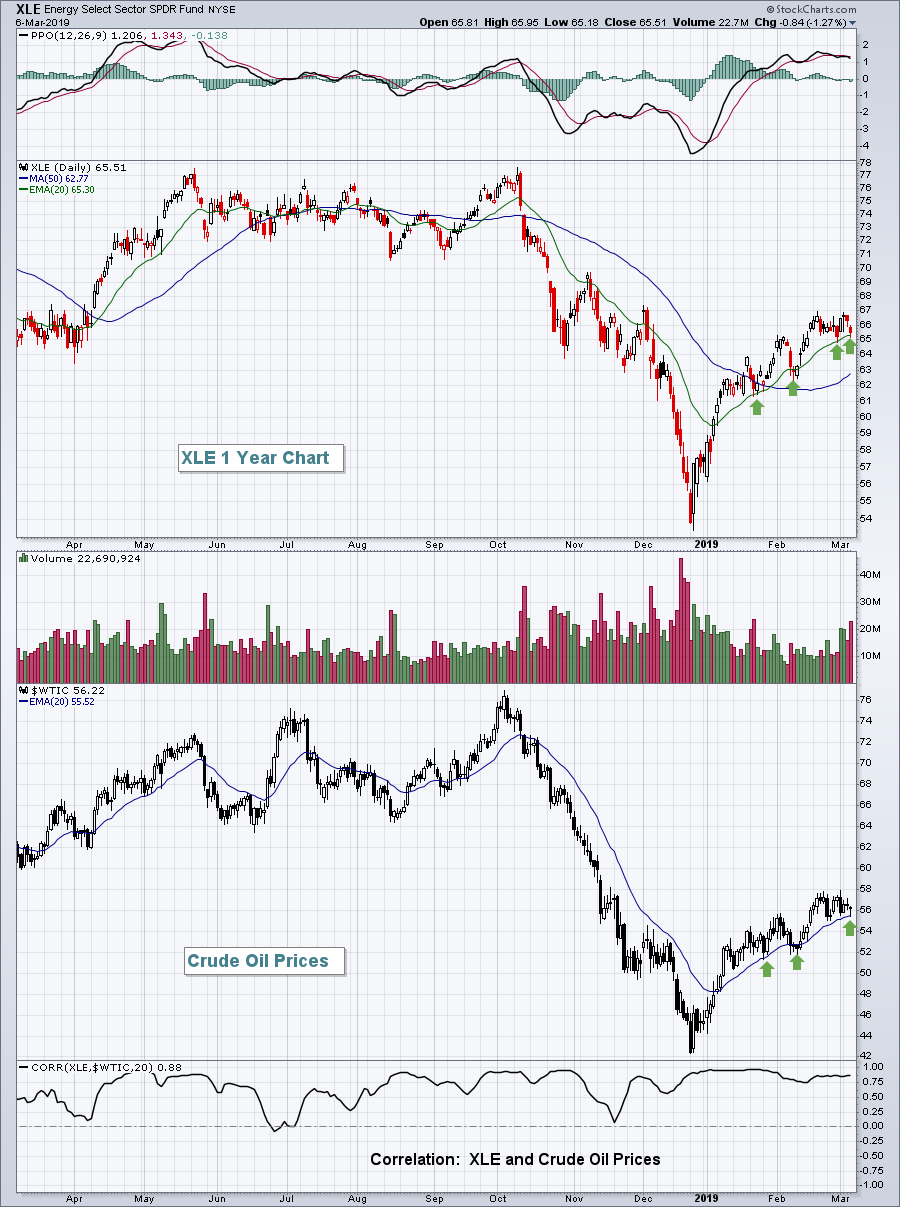 These two charts (XLE and $WTIC) look almost like mirror images and the positive correlation is obvious throughout the year. If you're trading the XLE or energy shares in general, you want to keep an eye on crude oil prices. So long as their trend remains higher, so too shall the XLE's.
Historical Tendencies
Costco (COST) reports its latest quarterly results after the bell tonight. Historically, COST typically performs best during the last 4 months of the year. Here's a breakdown of COST's average gains over the past 20 years:
January through August: +3.6%
September through December: +9.1%
Here's the seasonal chart:
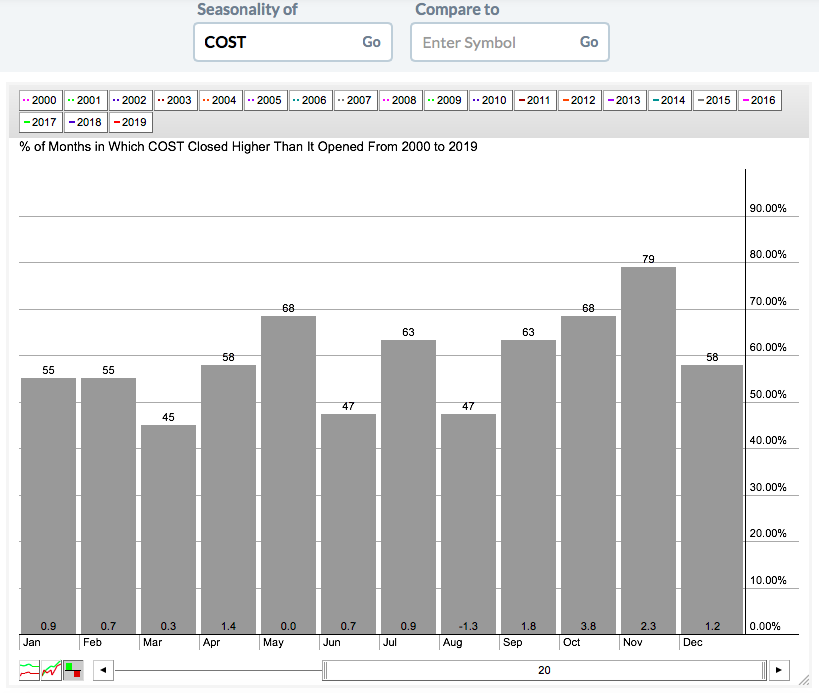 March has risen just 45% of the last 20 years, producing an average monthly return of 0.3%, trailing only August (-1.3%) and May (+0.0%). While COST could do absolutely anything after its earnings report tonight, its best seasonal period clearly is later in the year.
Key Earnings Reports
(actual vs. estimate):
BURL: 2.83 vs 2.77
KR: .48 vs .51
TECD: 4.55 vs 4.10
(reports after close, estimate provided):
COST: 1.67
MRVL: .26
OKTA: (.08)
Key Economic Reports
Initial jobless claims released at 8:30am EST: 223,000 (actual) vs 220,000 (estimate)
Q4 productivity released at 8:30am EST: 1.9% (actual) vs. 1.6% (estimate)
Happy trading!
Tom


