Market Recap for Wednesday, April 17, 2019
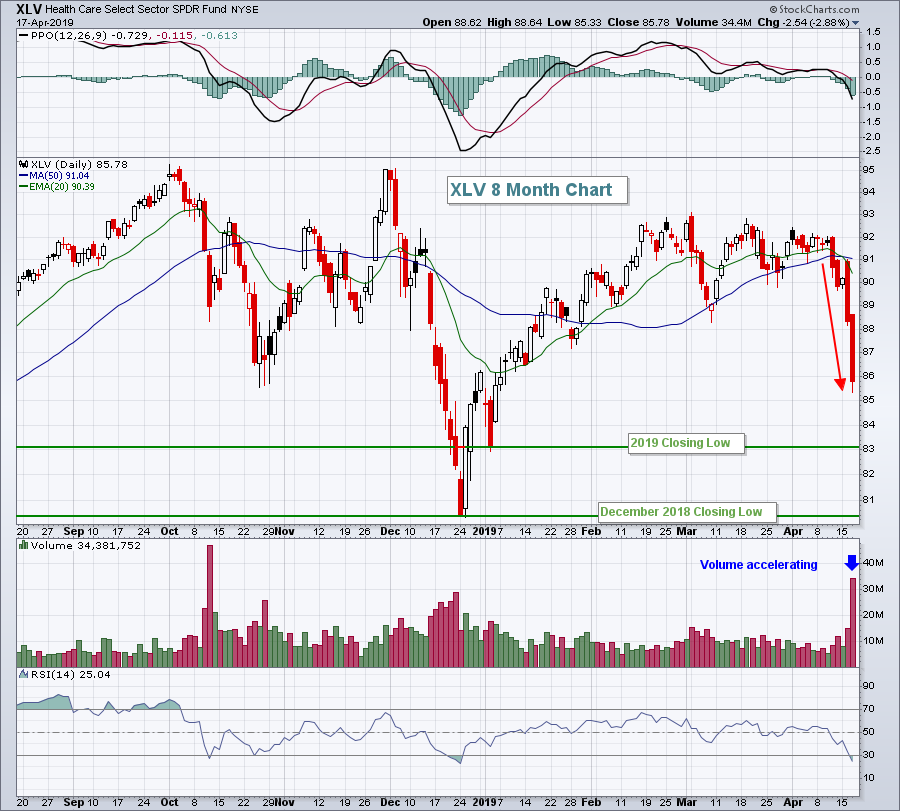
We saw mixed trading on Wednesday with the benchmark S&P 500 falling 0.23% to end the session at 2900, still roughly 1.5% beneath the all-time high set in 2018. Technology (XLK, +0.56%) and consumer staples (XLP, +0.50) led the action, but the continuing fall in healthcare (XLV, -2.88%) was the bigger story. The XLV is now down 6.53% over the last week and is rapidly moving towards its 2019 low:
 Rising political pressure to reduce healthcare costs has been the overriding theme this past week as the XLV has reached short-term oversold conditions with its RSI now at 25.
Semiconductors ($DJUSSC, +1.75%) and computer hardware ($DJUSCR, +1.60%) led technology higher. Both of these industry groups have been huge leaders throughout the rally off the December lows. As long as money continues to rotate into aggressive groups like these, it'll be difficult for the bears to regain any semblance of control.
Pre-Market Action
We received solid economic news this morning as initial claims fell to 192,000 and March retail sales came in stronger than expected (more information in the Key Economic Reports section below). Despite this positive news, the 10 year treasury yield ($TNX) is down 2 basis points to 2.58%. The bond market is not convinced that our economy is that strong and that does remain a concern. But thus far, stock market participants are cheering on this low growth, low interest rate environment.
Crude oil ($WTIC) is up slightly this morning and currently trades near $64 per barrel.
Asian markets were weak overnight, while European markets are mixed.
Dow Jones futures are pointing to a slightly higher open, up 32 with 30 minutes left to today's opening bell.
Current Outlook
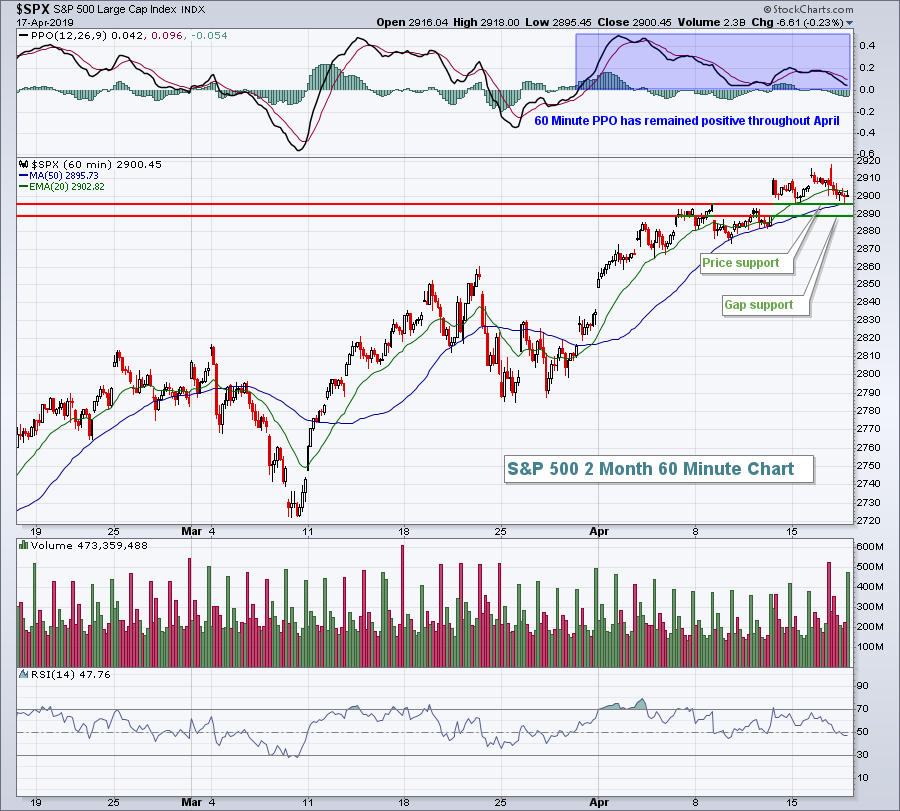
The short-term 60 minute charts remain quite positive. It's noteworthy that the hourly PPO has been above zero throughout April thus far, illustrating the bullish short-term momentum. I try not to call an end to a market move like this. I'd rather let the charts tell me, so here's what I'm looking at right now:
 If we drop much below that 2890 gap support level, then we should re-evaluate the short-term conditions. Until then, I'll remain bullish. A drop beneath 2890 wouldn't be a bearish development, it would simply indicate that we should move to the daily chart to consider the possibility of further near-term weakness in an otherwise uptrending market.
Sector/Industry Watch
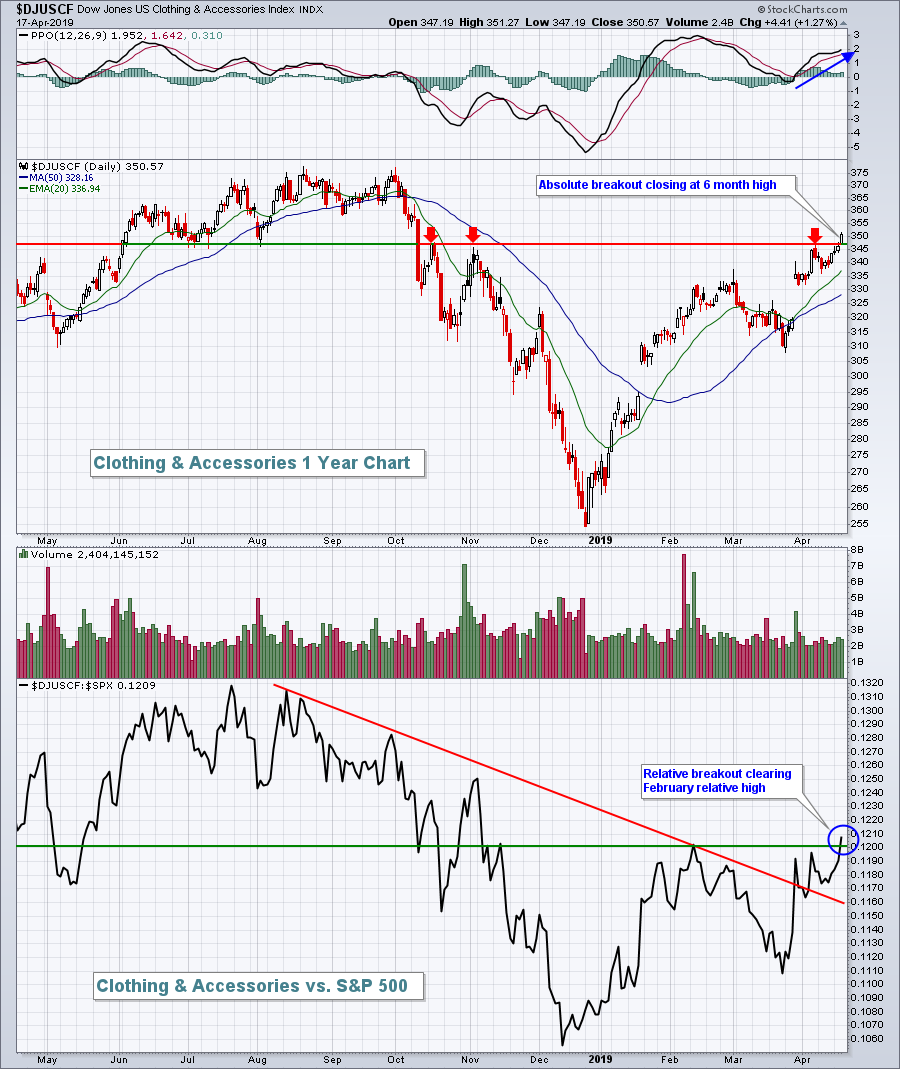
Clothing & accessories ($DJUSCF, +1.27%) broke out to a new 2019 closing high and also broke out on a relative basis, potentially setting up nice trading opportunities in this group during earnings season:
 We already know the consumer discretionary area (XLY) has been outperforming the S&P 500 throughout the current 4 month rally, so seeing the DJUSCF break out is a very good sign for this industry.
Historical Tendencies
Yesterday, I broke down April performance on the S&P 500. Today, let's look at the NASDAQ (since 1971):
April 1-18: +21.45%
April 19-28: +6.31%
April 29-30: +28.90%
Those are the annualized returns since 1971. There's clearly a drop off in performance beginning April 19th, but at least it does remain positive. Seasonal tendencies support technical conditions. We're likely to see those all-time highs tested soon.
Key Earnings Reports
(actual vs. estimate):
ALLY: .80 vs .79
AXP: 2.01 vs 2.00
BBT: 1.05 vs 1.03
BX: .44 vs .52
CFG: .93 vs .89
CHKP: 1.32 vs 1.31
DHR: 1.07 vs 1.01
DOV: 1.24 vs 1.12
GPC: 1.31 - estimate, awaiting results
HON: 1.92 vs 1.83
KEY: .40 vs .42
PM: 1.09 vs .99
PPG: 1.38 vs 1.21
RCI: .59 vs .72
RF: .37 vs .37
SLB: .30 vs .30
STI: 1.33 vs 1.29
SYF: 1.00 vs .88
TRV: 2.83 vs 2.76
TSM: .38 - estimate, awaiting results
UNP: 1.93 vs 1.89
(reports after close, estimate provided):
ISRG: 2.70
Key Economic Reports
Initial jobless claims released at 8:30am EST: 192,000 (actual) vs. 206,000 (estimate)
April Philadelphia Fed survey released at 8:30am EST: 8.5 (actual) vs. 10.2 (estimate)
March retail sales released at 8:30am EST: +1.6% (actual) vs. +0.8% (estimate)
March retail sales less autos released at 8:30am EST: +0.9% (actual) vs. +0.4% (estimate)
April PMI composite flash to be released at 9:45am EST: 54.3 (estimate)
February business inventories to be released at 10:00am EST: +0.3% (estimate)
March leading indicators to be released at 10:00am EST: +0.3% (estimate)
Happy trading!
Tom


