Market Recap for Tuesday, April 16, 2019
It was just another day of boring gains. But that's what happens during bull market advances. The Volatility Index ($VIX, -1.14%) drifts lower and stock prices edge higher. Remember when the VIX topped out with a close above 36 on December 24th? It seems like forever ago as the VIX closed yesterday at 12.18. I've written on many occasions that the VIX never closed below 16 during either of the past two bear markets. With a VIX currently near 12, it's almost a foregone conclusion that we'll be breaking out to fresh 52 week and all-time highs sooner rather than later. In my opinion, you can let go of any bearish thoughts you might still be carrying. It's just an opinion, not a guarantee, but bear markets require fear and the falling VIX signals that there isn't any. None of this means we won't see periods of selling, but I'd be a buyer into those periods.
On Tuesday, all of our major indices advanced, led by the NASDAQ's 0.30% rise. The NASDAQ 100 rose 0.34%, a tad higher. That's a bit surprising as financials (XLF, +1.41%) were atop the sector leaderboard by a wide margin and financials have very little representation on the NASDAQ 100. Partly responsible for the NASDAQ's advance, however, was the late day surge in Qualcomm shares (QCOM, +22.98%). The royalty dispute between QCOM and Apple, Inc. (AAPL, +0.01%) was settled just as trial proceedings were starting. Later, Intel Corp (INTC, +0.76%) said it was pulling out of the 5G smartphone market. QCOM is up another 12% in pre-market this morning after surging in the final hour on Tuesday. Check out this intraday chart:
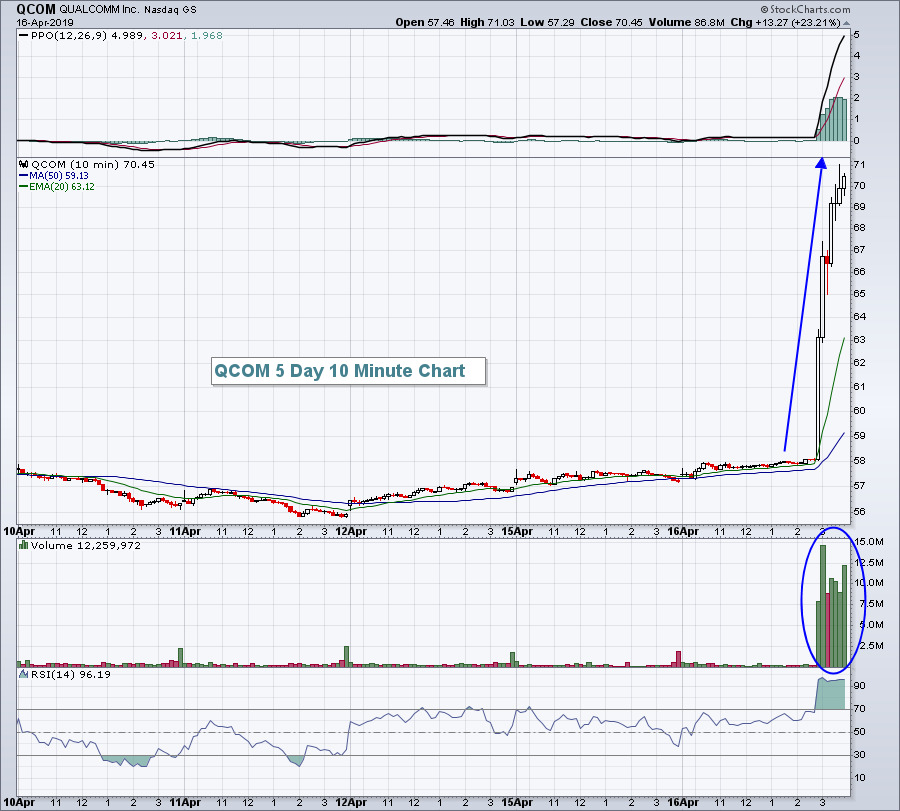 To say there was a bullish response in QCOM would be a massive understatement. This news completely changes the outlook for QCOM on a forward-looking basis as two major business obstacles have been removed.
There was plenty of bifurcation among sectors. While financials were quite strong, real estate (XLRE, -2.36%), healthcare (XLV, -2.05%) and utilities (XLU, -1.24%) all fell hard. Technology (XLK, +0.51%) received a lift from QCOM. Semiconductors ($DJUSSC, +2.75%) continued their rapid ascent higher.
Pre-Market Action
Futures are higher in the U.S. this morning, led by the NASDAQ. QCOM's pre-market move is no doubt skewing the picture in the NASDAQ's favor. Dow Jones futures are higher to a lesser extent, currently up 51 points.
The 10 year treasury yield ($TNX) is up to 2.61% this morning and this should provide tailwinds for the financials.
Current Outlook
Seasonally, the S&P 500 tends to run higher this week, then struggle next. The Historical Tendencies section below provides more information on that. But the seasonality could align quite nicely with what we might expect technically as well. The S&P 500 closed yesterday at 2907 and is now just a tad over 1% away from its all-time high of 2940.91. I'd expect to see at least short-term sellers line up at that 2940 level and we could approach it this week with one or two more days of solid market action:
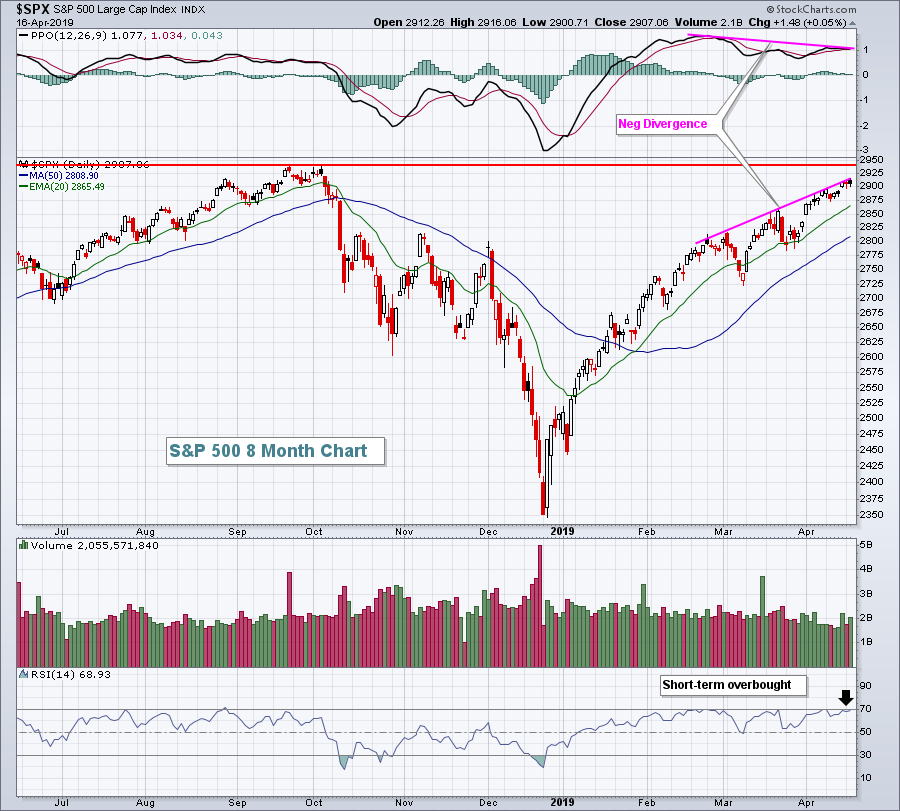 The negative divergence isn't helping here. Throw in short-term overbought conditions and I think we have a market poised to at least consolidate over the next couple weeks, especially if we test overhead price resistance and fail.
Sector/Industry Watch
Financials (XLF) are beginning to look much, much better on a longer-term weekly chart. We've not only broken above stubborn intermediate-term price resistance at 27, but we've also seen the weekly PPO turn positive for the first time since Q3 2018. The S&P 500's weekly PPO turned positive in February and we've seen what's happened there. I expect financials will lead the stock market higher in Q2. Here's the current look:
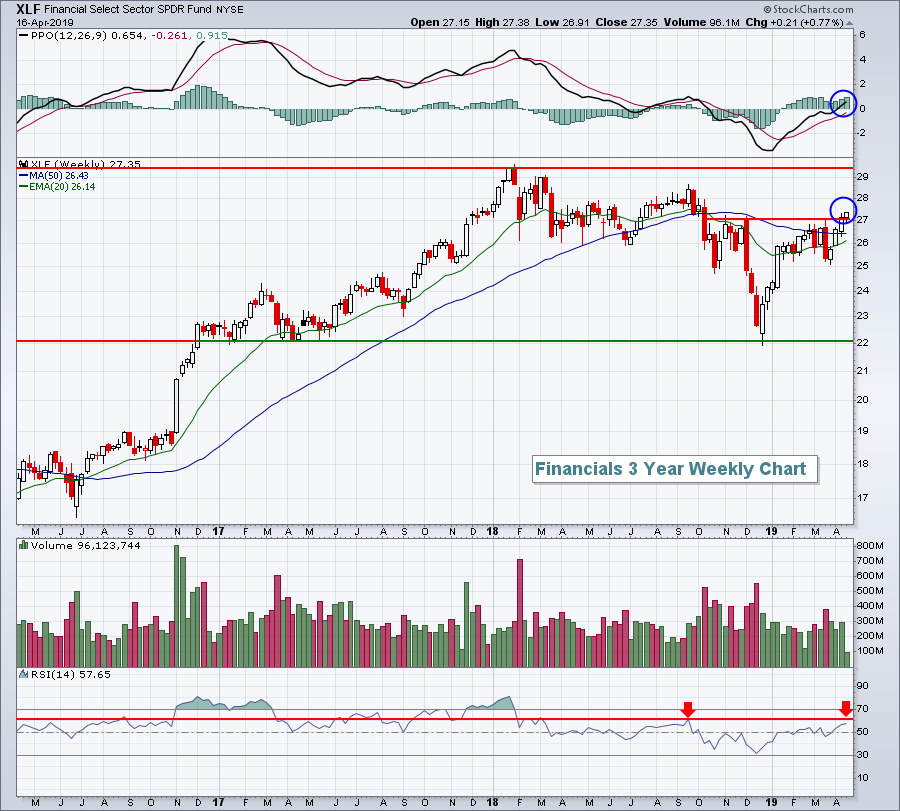 Since the XLF topped in January 2018, the weekly RSI has stayed below 60, indicative of a downtrend. So I'll be looking for the weekly RSI to push through 60 to confirm the other bullish signals that are emerging.
Historical Tendencies
I posted earlier this month that we typically see pre-earnings rallies. Well, unfortunately we also tend to see weakness as the earnings reports begin to stream in. It's a bit of the old Wall Street adage, "buy on rumor, sell on news". Check out these historical April results on the S&P 500:
April 1-18: +28.48%
April 19-30: +2.23%
Key Earnings Reports
(actual vs. estimate):
ABT: .63 vs .61
ASML: 1.43 vs .54
BK: .94 vs .96
ERIC: .09 vs .04
KSU: 1.54 vs 1.45
MS: 1.33 vs 1.17
PEP: .97 vs .92
TXT: .76 vs .70
USB: 1.00 vs 1.00
(reports after close, estimate provided):
CCI: 1.43
CCK: 1.05
ETFC: .94
KMI: .25
LVS: .85
SLG: 1.72
TEAM: .18
TMK: 1.59
URI: 3.12
Key Economic Reports
February wholesale inventories to be released at 10:00am EST: +0.3% (estimate)
Beige book to be released at 2:00pm EST
Happy trading!
Tom


