Market Recap for Monday, May 6, 2019
The session got off to a very rough start as global market were hit hard following word that US-China trade talks were off the tracks once again. President Trump warned of steeper tariffs and Chinese officials said they were considering abandoning talks altogether. That produced sellers everywhere, including the U.S., where the S&P 500 quickly fell to a low of 2898, challenging the low set two days earlier at 2900. Once again, however, buyers returned and scooped up cheaper shares as our major indices rallied throughout the session. The Dow Jones turned a 500+ point loss at the open into a 66 point loss by the close. The Russell 2000, which broke out above 1600 for the first time since early October on the strong nonfarm payrolls report, was down 26 points in early action, but managed to eke out a minor gain by the close, adding to its recent relative outperformance.
Healthcare (XLV, +0.51%) was the sector leader and one of only two sectors to finish in positive territory. Energy (XLE, +0.09%) was the other. The XLV continues to consolidate on its longer-term weekly chart in what appears to be a symmetrical triangle:
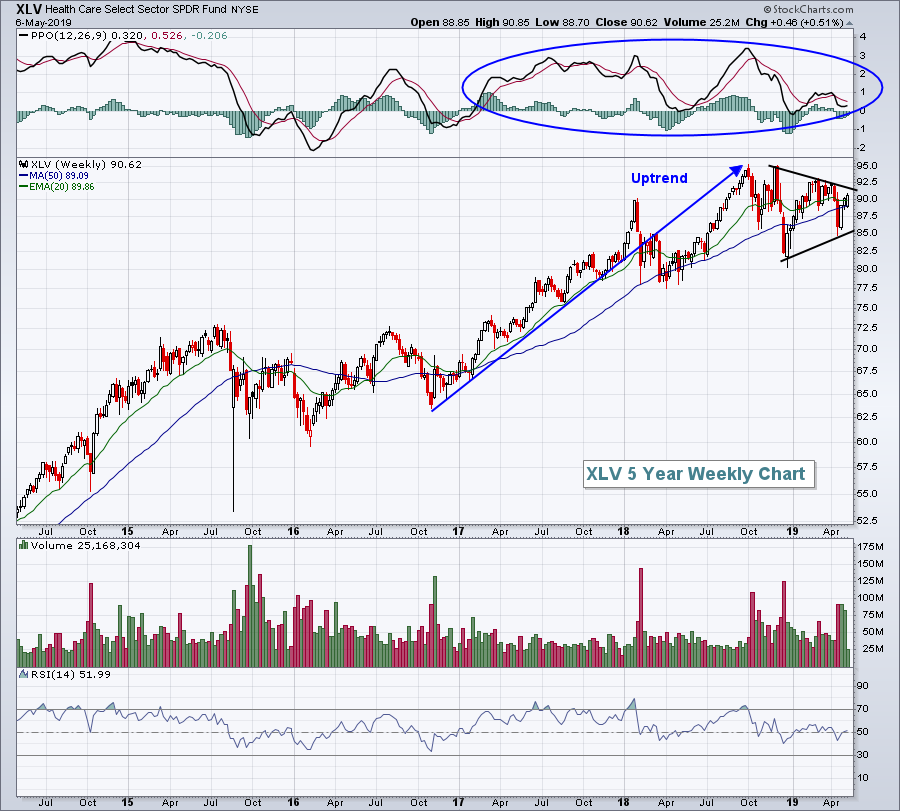 Symmetrical triangles tend to resolve in the direction of the prior trend, which is clearly higher in this case. Also, note that the weekly PPO has remained positive throughout the past 2+ years. I'm expecting to see the XLV rally from this level.
Materials (XLB, -1.43%) were the primary laggard on the session as the U.S. Dollar Index ($USD) was able to hold its ground above its rising 20 day EMA.
Pre-Market Action
The U.S. announced new tariffs are coming on Friday and futures are once again on the defensive. Currently, Dow Jones futures are lower by 164 points as we approach today's open. Asian markets were mixed overnight, but we're seeing clear weakness in Europe this morning.
The 10 year treasury yield ($TNX) is down another 3 basis points to 2.47% as money seeks out safety for a second day in a row.
Current Outlook
On a weekly chart, the S&P 500 rally since December looks as though it's been relentless.....and, for the most part, it has. But when we move to the daily chart and, especially the hourly chart, we see breaks in the uptrend. Fortunately, the weakness hasn't lasted long and we've been able to move higher. That will come to and end eventually and we'll likely move into a period of short- to intermediate-term consolidation. Take a look at the following hourly chart to get a sense of how the S&P 500 has been trading the past two months:
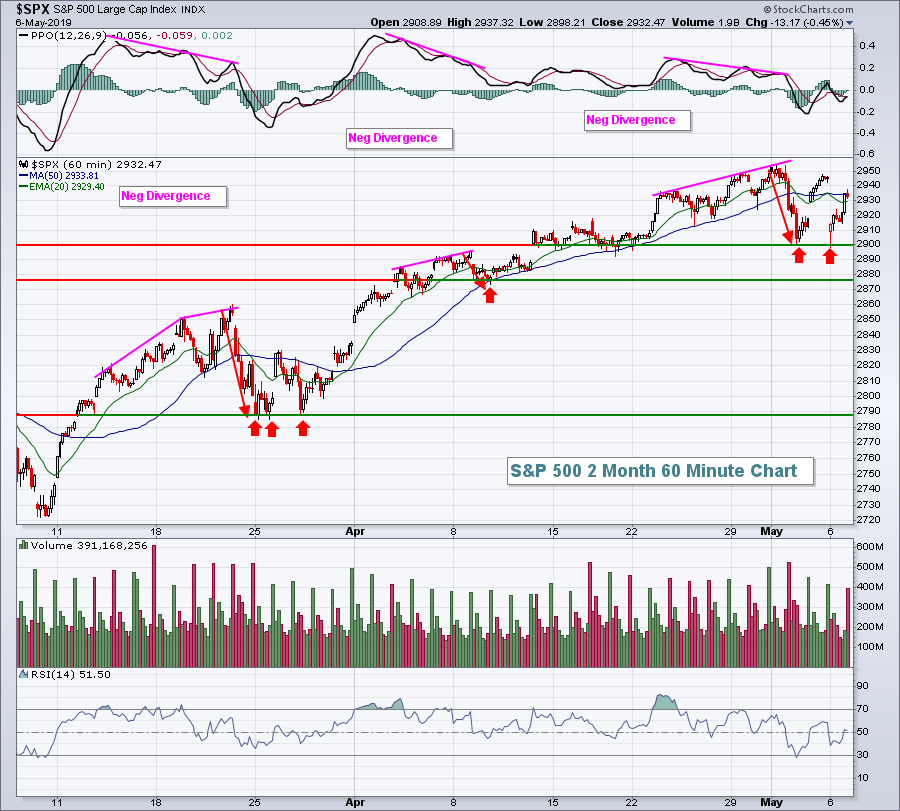 Short-term momentum does become a problem from time to time as the negative divergences illustrate. However, the initial bout of selling establishes a price support level from which buyers resume. In each of the prior two cases, that initial price support has held on additional bouts of selling. Therefore, I'm watching the 2900 level of price support where we currently have a double bottom in place. Should we lose that support level, my opinion is that the S&P 500 could struggle further. Keep in mind that aligns with the longer-term historical track record in May, which suggests the 6th through the 25th is the weakest time of the month.
Sector/Industry Watch
Health care providers ($DJUSHP, +2.49%) was easily the best performing industry group yesterday as it continues to battle through overhead resistance created from huge selling and two month underperformance that began in mid-February:
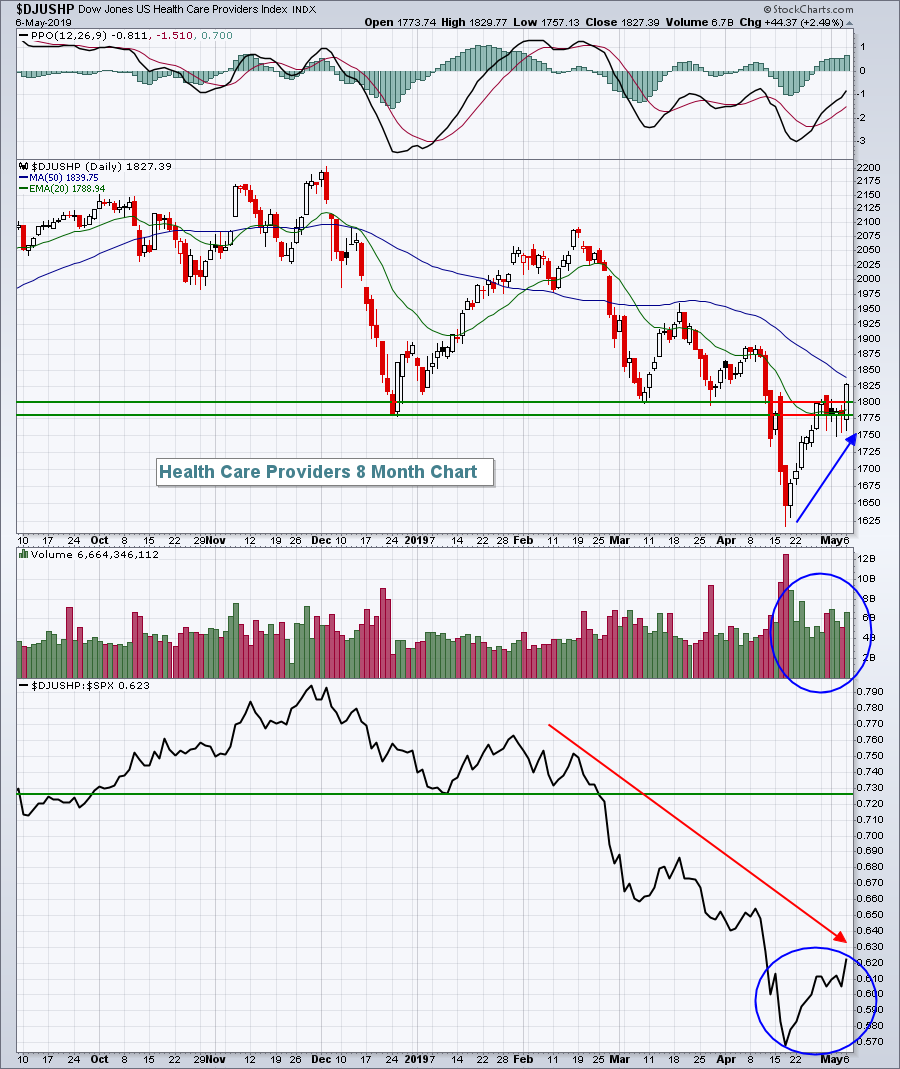 The 50 day SMA is next up in terms of resistance with the failure at that moving average in mid-March still fresh in the minds of traders. A close above the 50 day SMA would be a very positive development for the group.
Monday Setups
During my MarketWatchers LIVE show yesterday, I discussed several potential trade candidates. I'd be careful this week because of all the trade talk and concerns. The war of words had a significant impact on trading yesterday and it's likely to remain in the news in the near-term as the U.S. and China attempt to work out their differences.
My pick this week is Meritor, Inc. (MTOR). After gapping up on earnings to open May, MTOR has sold off to test its rising 50 day EMA and price support:
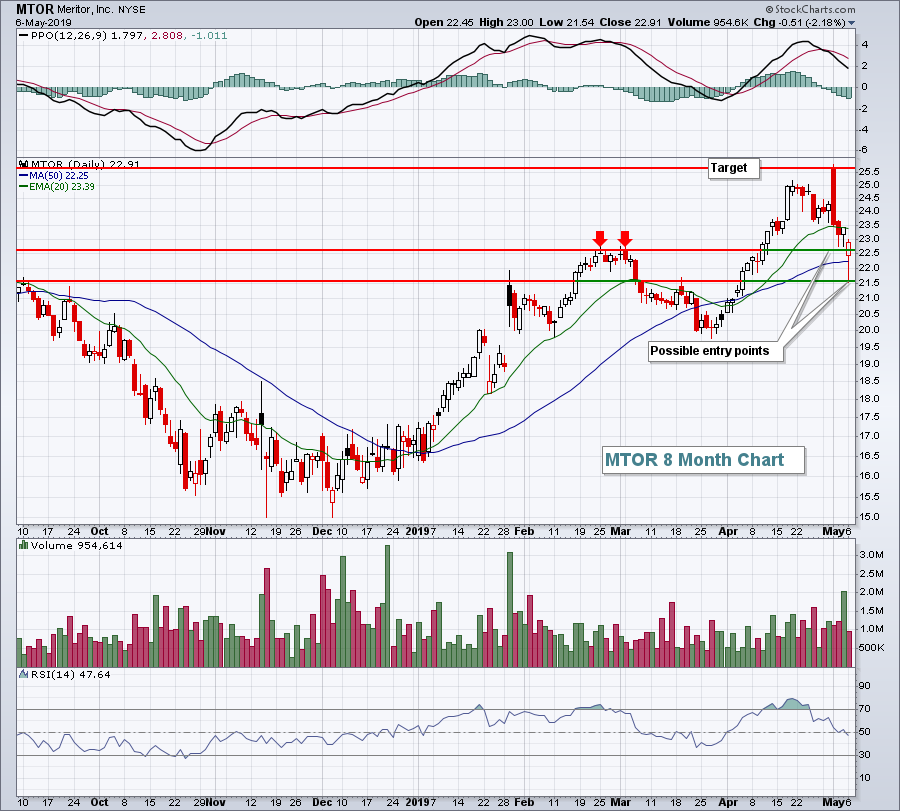 I like the way that MTOR closed yesterday, although the overall market rallied throughout the day after significant losses to open the session. The trend remains up here, so I believe the recent selling is an opportunity.
Historical Tendencies
Since 1971, here are the annualized returns on the NASDAQ for the following calendar months:
May: +12.83%
June: +7.74%
July: +5.38%
August: +2.25%
September: -5.14%
As you can see, the deeper we move into summer, the worse the NASDAQ performs historically.
Key Earnings Reports
(actual vs. estimate):
ABEV: .05 - estimate, awaiting results
AES: .28 vs .30
AGN: 3.79 vs 3.55
BR: 1.59 vs 1.49
BUD: 1.27 vs 1.27
EMR: .84 vs .84
EXPD: .80 vs .85
IT: .58 vs .53
JEC: 1.19 vs 1.22
MLCO: .28 vs .25
MYL: .82 vs .79
RACE: 1.08 vs .89
REGN: 4.45 vs 5.52
SRE: 1.92 vs 1.69
TDG: 4.21 vs 3.86
(reports after close, estimate provided):
ATO: 1.68
EA: .97
FANG: 1.36
FLT: 2.62
LYFT: (1.12)
MTCH: .33
PAA: .59
S: (.02)
Key Economic Reports
None
Happy trading!
Tom


